
Generating Discover Reports
Accessing Reports
To create a Report, or to download a report recently generated by your team
- go to Reports in the Navigation bar and
- select a Focus in the dropdown.
If any reports were created for Feeds in this Focus recently, any user will see them listed in the sidebar and will be able to download them directly. Else, in this page we will explain you how to create the report you need and make it available to the rest of your team, step by step!
Please Note: For Online Reports you will need to select your Brand to generate your Online Branded MIV for them to become available.
Creating new Reports
Once you have selected a Focus, the Report definition options will appear.
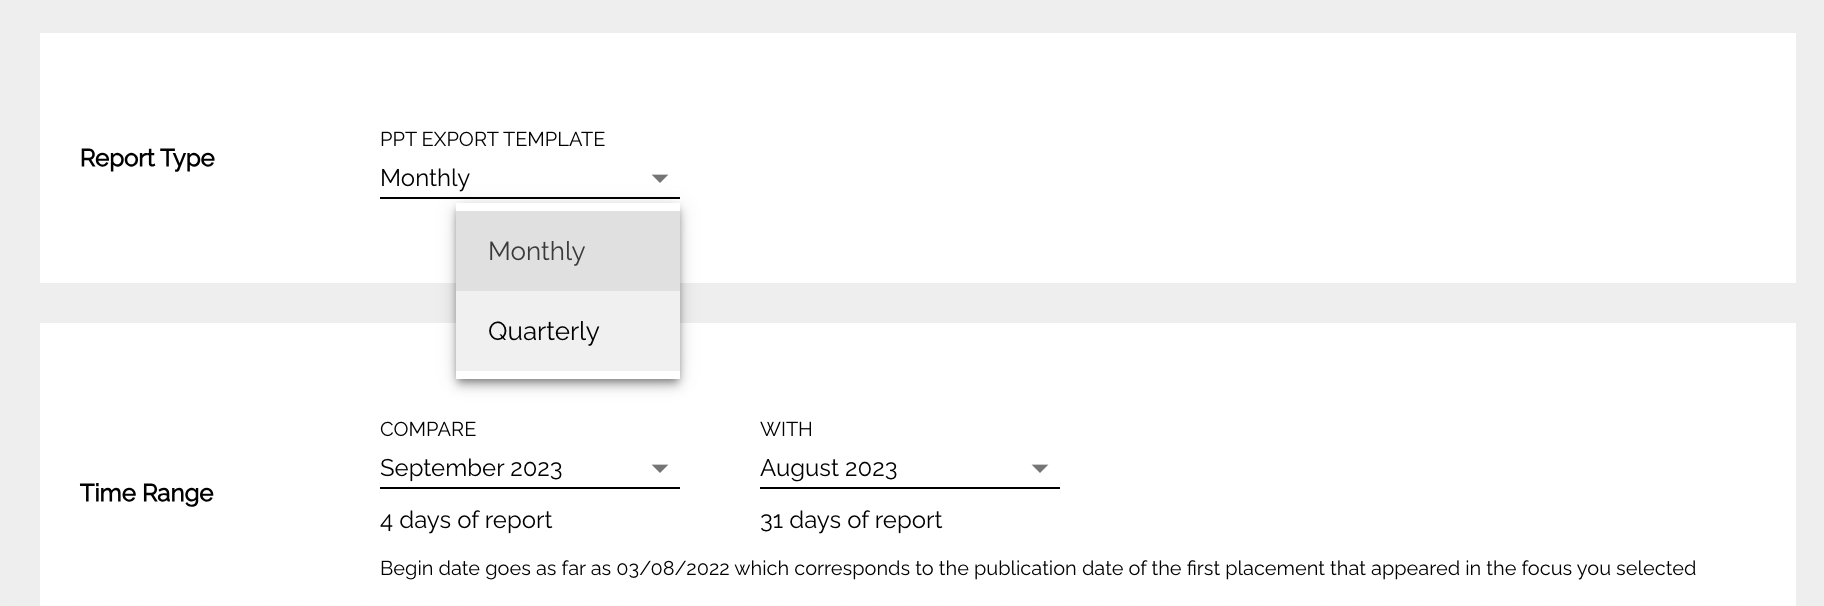
Select a report type
First, select the type of report you want to generate. You can generate 4 different types of reports in Discover, that can be used right away or serve you as a basis for your own report formats:
| Report Name | File type | Description |
| Data Report | .xls |
A book containing a spreadsheet per Feed included in the report, with lines for each individual placement including all the relevant indicators available. AlternativeIf a Data Report is what you want, you can also easily download it from the Feeds Result page. Just use your filters to make a selection and click on the Export to Excel option. |
| Campaign Report | .ppt | A file editable with PowerPoint and similar software, that includes statistics and clippings including some key data points for a range of dates. |
| Periodic Report | .ppt | A file editable with PowerPoint and similar software, that includes statistics and clippings including some key data points for a month or a quarter, compared to the previous one. |
| Coverage Book |
web (.ppt & .pdf) |
A public url with a web view of the placements captured in a range of dates that Discover users can edit and share. |
Select a timeframe
Select the time frame which you would like you reports to focus on.
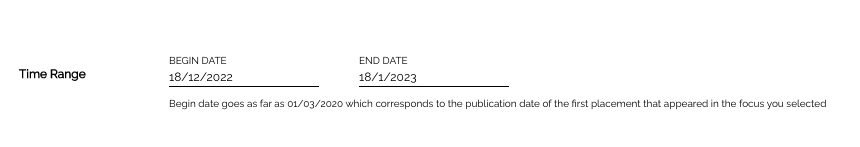
| Coverage Book, Campaign Report, and Data Reports | Periodic Reports |
| Select any start and end dates. | Select either a Monthly or Quarterly time range. |
 |
 |
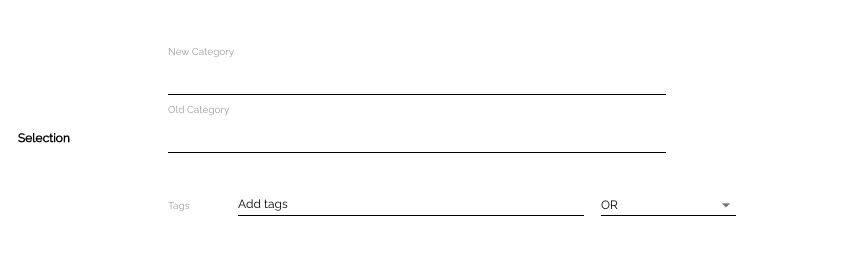
Select categories or tags
Use the category or the tags to select the articles which you would like you reports to focus on.
Please note that the tag number is calculated without taking into account your current date filter periods asked for your report. It shows the number of all documents that are tagged within this tag disregarding the other filters.
Once you reach this point you'll need to save your configuration to move forward.
Select the locations included
You can make a report that includes data for all or some locations, and change the format of your report to group data by location.
Select the language and currency of your report
You can easily create reports in multiple languages and currencies, and combine these however you want.
| Languages | Currencies |
|
|
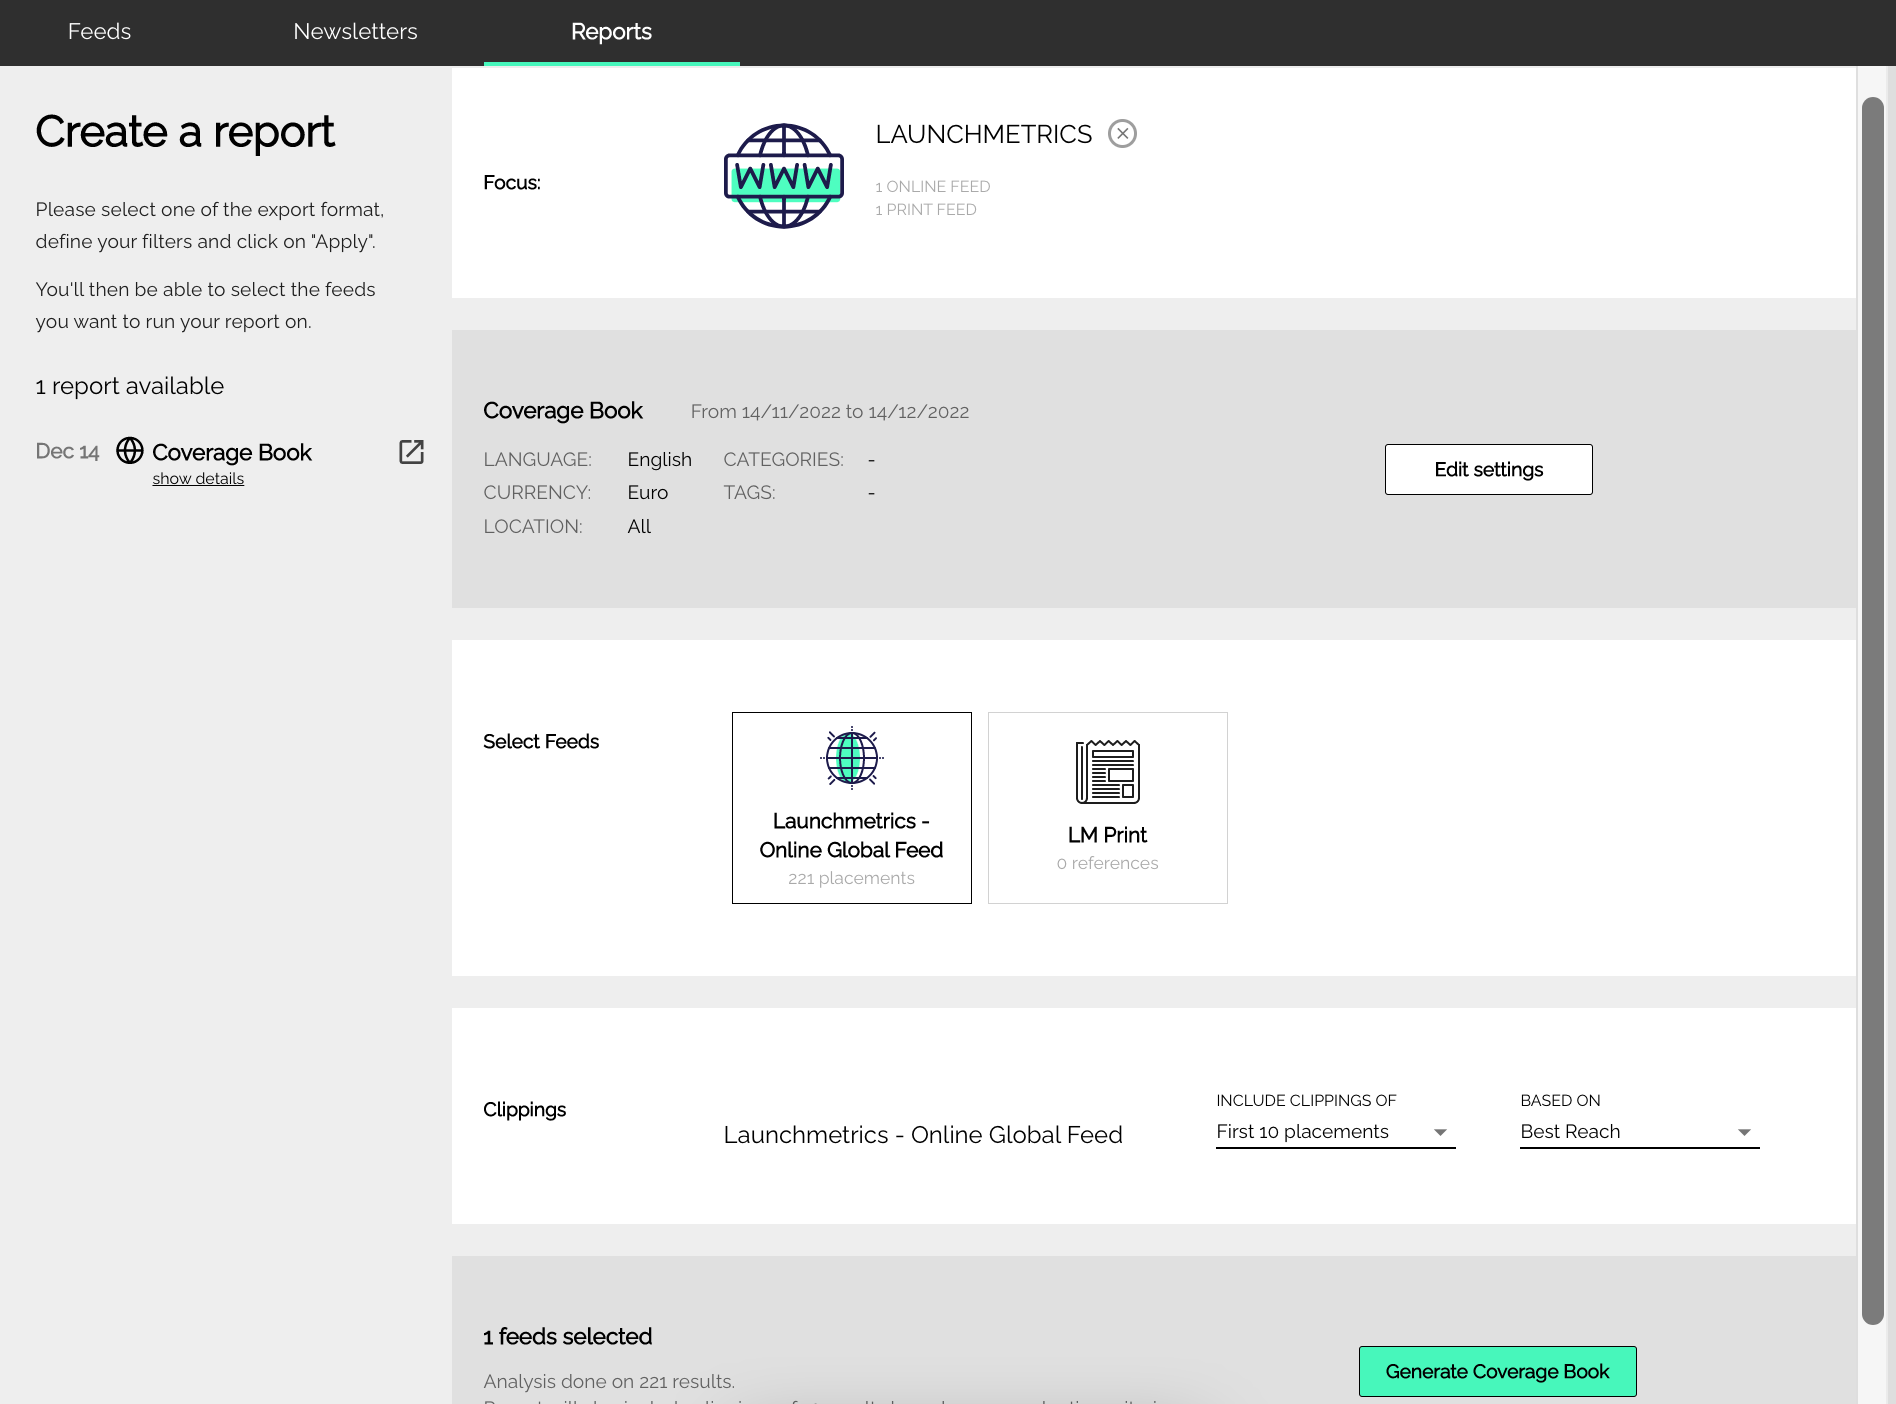
Select the Feeds you want to include
This section will show all of the feeds that have been created for the selected Focus.
When creating a report you can select as many Feeds as you'd like the report to focus on. Feeds that have been selected will go from grey to green. In the example above, the Launchmetrics - Online Global Feed has been selected, while the LM Print feed has not been selected.
Missing placements?
If you find an article or social post is missing from your from reports, you are able to manually insert mentions. Please reference the articles above about creating Online or Social media feeds to learn how to insert mentions.
Add clippings
When using only either of Export Format, Coverage Book and Monthly Report, additional options will need to be selected per feed. See the yellow highlights in the screenshot above. These include:
Allows you to select the amount most recent mentions which you want to report to show, and the criteria you prefer to use to sort them.
- Best Audience will show the mentions with the largest reach.
- Most Engagement will show the mentions with the most likes and shares.
- Latest will show the most recent mentions published.
Generate the report
Once the export format, time range, and feeds are selected, the green generate button will be available for you to select. This will start the generation process.
You can follow the progress of the report generation, and download your reports in the left nad section, where you also see any recently generated reports for the same Focus.
You may notice that reports with a higher number of clippings take some more time to be completely ready. Don't worry, as this is a normal behavior. To improve your experience when reports need a longer generation time, we will also email the resulting report to the email address of the user who generated it in Discover.