Find here all Insights releases:
Insights Release / December 4th 2023
🗓 Released on December 4th
✨Daily Data Updates
We're thrilled to introduce a powerful new feature in Insights - Daily Data Updates. This enhancement brings a more responsive and dynamic approach to data retrieval, ensuring that your insights are not just current but updated daily with the latest information from Print, Online and Social channels.
What's New?
At each update we capture all documents that have been modified or created since the last update.
Print: updates once a day during the night (3am UTC).
Online and Social: update six times a day, every four hours
Limitations
Chinese Social Data remains on a weekly update cycle, transitioning to daily updates in a couple months.
Feedback
Your input is crucial as we continue to refine and optimize Insights. We hope the Daily Updates feature enhances your data analysis experience. Thank you for choosing Insights for your evolving data analysis needs!
Insights Release / November 22nd 2023
🗓 Released on November 22nd
✨Save and Share Report
We're thrilled to announce a powerful new feature in Insights that will change the way you interact with your data - the "Save and Share Report" functionality. With this update, you can now effortlessly create, save, and share customized reports tailored to your specific needs.
What's New?
Save Your Insights:
Say goodbye to the hassle of recreating the same report every time you need it. Now, you can build your reports with the filters, groupings, and metrics that matter to you, and then save them as templates with a personalized name.
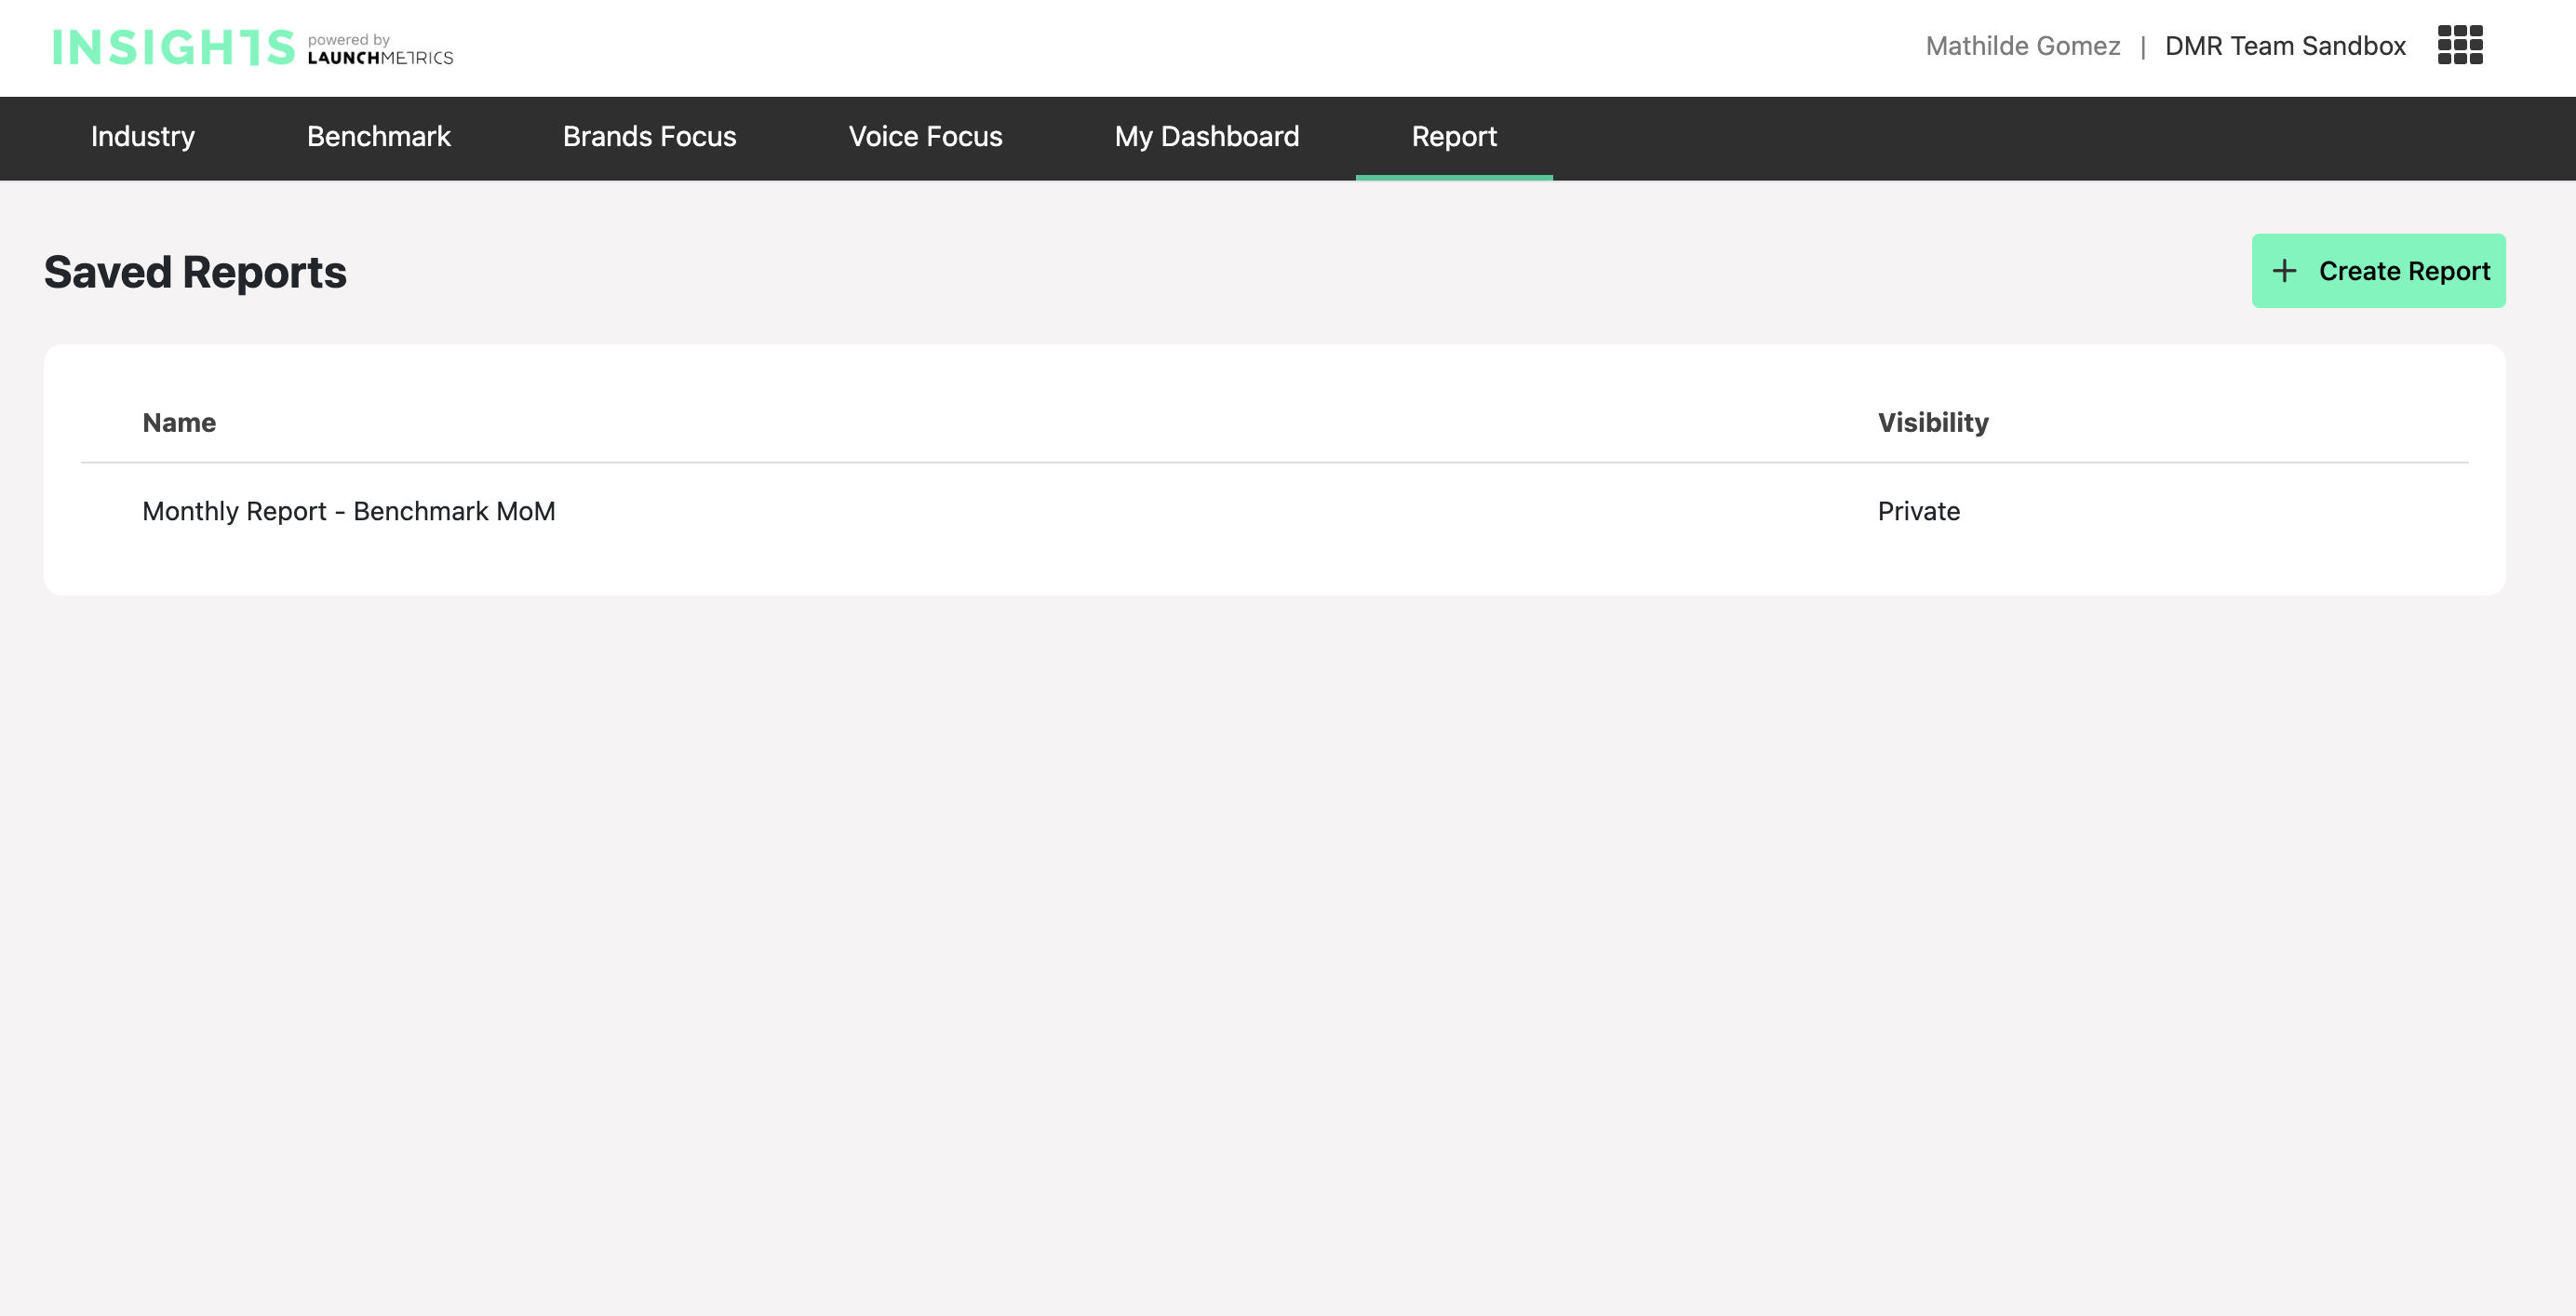
Effortless Retrieval:
Quickly locate your saved reports whenever you need them. Our intuitive interface allows you to effortlessly find your reports, ensuring that your insights are just a click away.
Personal or Shared Options:
Choose whether you want to keep your report exclusively for yourself or share it with all users. This flexibility ensures that you have control over who benefits from your meticulously crafted insights.
How Does It Work?
- Build Your Perfect Report
Select the filters, groupings, and metrics that align with your analysis requirements.
- Save with Ease
Save your report template with a meaningful name for easy identification later.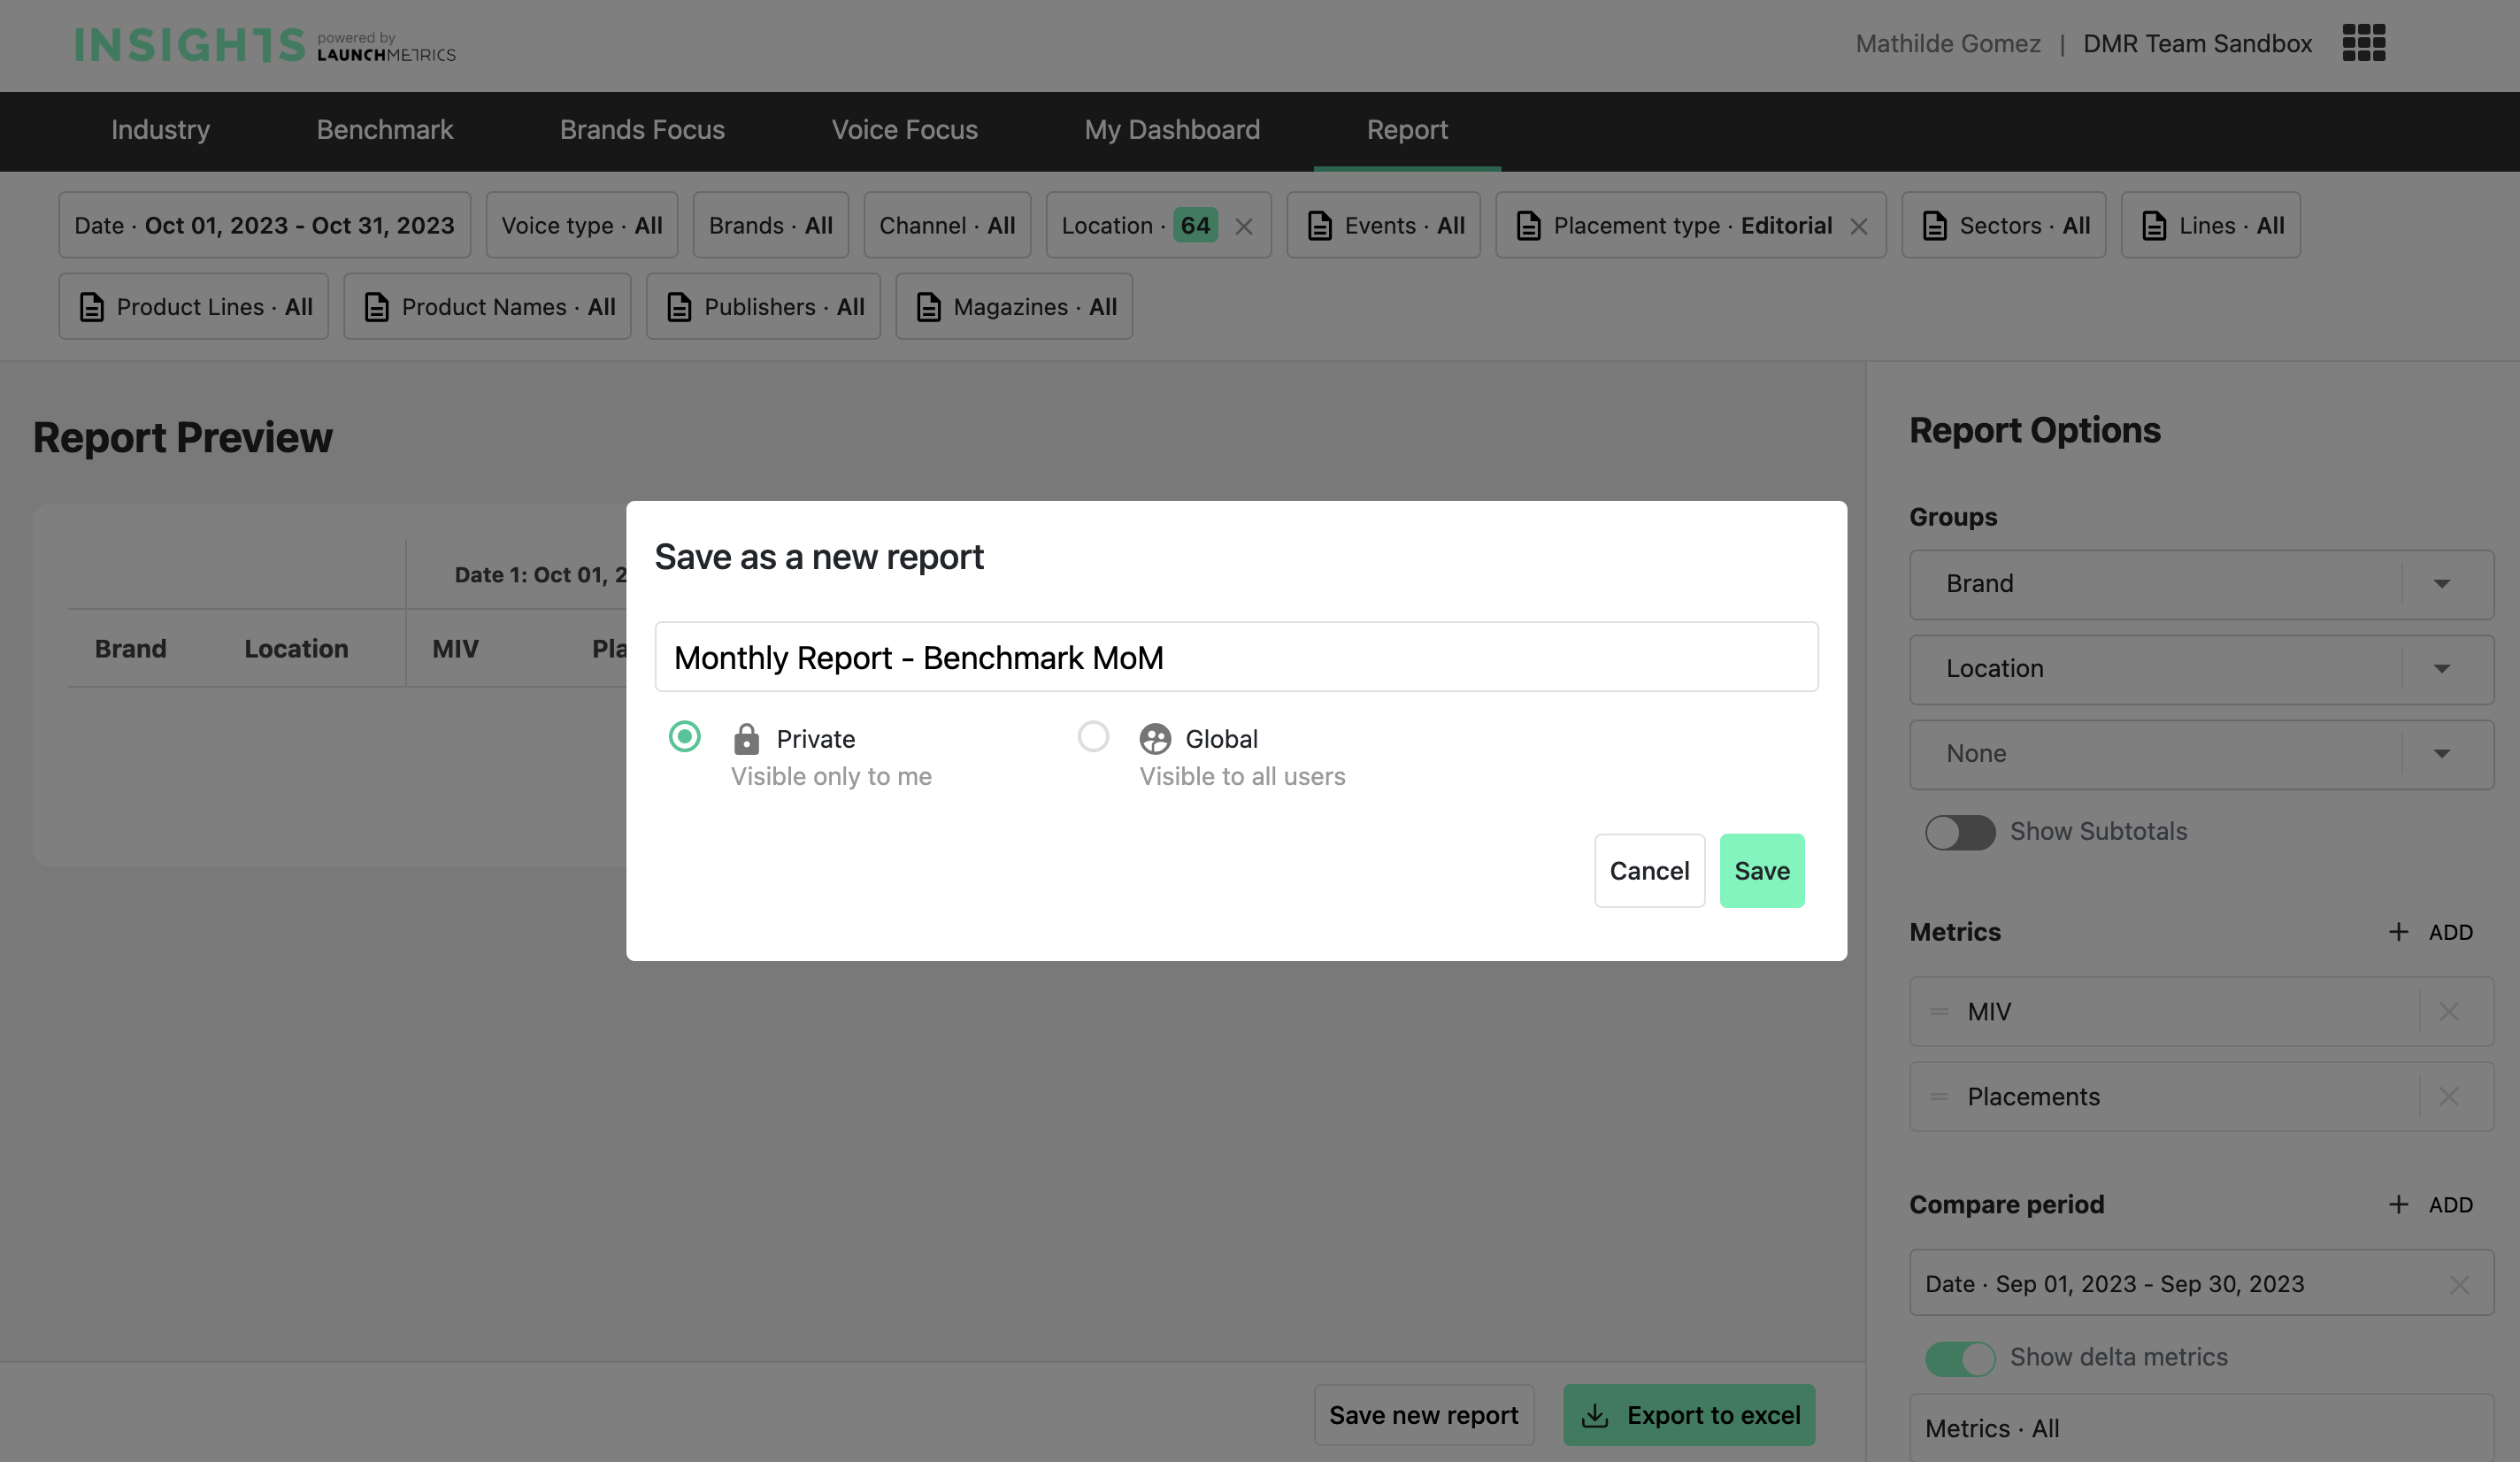
- Retrieve Anytime
Access your saved reports whenever you need them, eliminating the need to recreate the wheel every time.
- Share the Knowledge
Decide whether to keep the report private or make it accessible to all users, streamlining collaboration and knowledge-sharing.
Why It Matters
Time Efficiency
Save time by avoiding redundant work. Once you've created your report template, it's there whenever you need it.
Consistency
Ensure consistency in your analysis by using the same templates for repetitive tasks, be it weekly, monthly, or as needed.
Collaboration
Foster collaboration by sharing your valuable insights with your team, ensuring everyone is on the same page.
Note
- Templates can not be deleted yet
- Templates can not be shared across multiple sites
- Templates can not bu duplicated
This feature is designed to empower you with control, efficiency, and collaboration, making your data analysis experience in Insights more seamless and productive.
As always, your feedback is crucial to us, so feel free to share your thoughts as you explore this exciting new addition.
Insights Release / October 21st 2023
🗓 Released on October 20th
✨Report (beta)
Build your own Report with Insights new powerful feature in 6 easy steps:
1/ Filter the data

Refine your analysis by filtering your data with the filters available. You can find the usual cross-channel Insights filters as well as new ones specific to Print:
- Events
- Placement Type
Editorial, Advertising, Advertorial: by default, only Editorial is selected to align with the rest of the platform - Sectors
- Lines
- P lines
- Product names
- Publishers
- Magazines
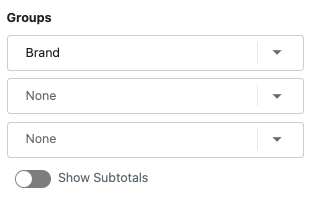
2/ Group by dimensions
Aggregate your data by different dimensions to get the right answers.
If you toggle “Show subtotals” there will be subtotals for each of your groups.
- Brand
- Channel
- Channel Type
- Voice Type
- Voice Name
- Magazine
- Location
- Event
- Publisher
- Sector
- Product line
- Line
- Product name
- Year
- Month
3/ Select metrics
Choose the relevant metrics to track for your analysis. By using “drag and drop” you can change the metrics order to make your report look exactly as you wish.
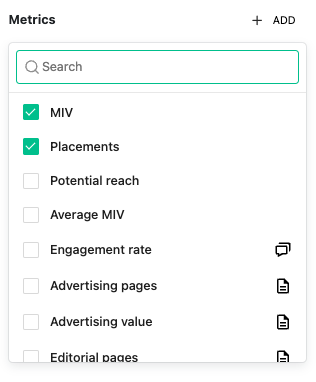
- MIV
- Placements
- Potential Reach
Circulation for Print, monthly visitors for Online and followers for Social. - Average MIV
- Engagement Rate
- Advertising Pages
Total number of paid advertising pages, including Advertorials. - Advertising Value
- Editorial Pages
The equivalent of all editorial credits in total pages (space occupied on the page). (¼ + ¼ + ⅔ = 1,16 Edi pages). - Editorial Value
- Cover Placements
- Full Page Placements
- Page Ratio %
- Monetary Ratio %
- Editorial Number
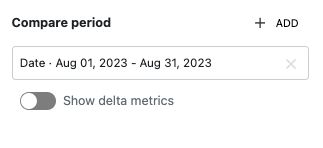
4/ Compare date periods
Select one or two periods to run a comparison. Pick any date you want with the date picker to refine your analysis.
To see the evolution of your metrics toggle “Show delta” and choose the metrics you want.
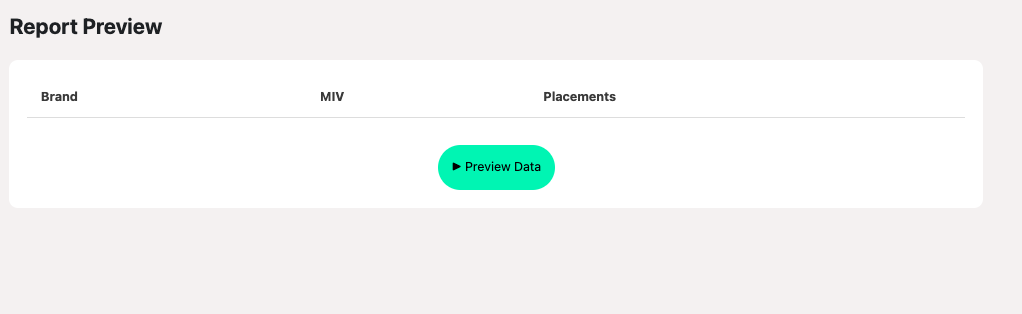
5/ Preview the template
At any point while building your Report you can Preview the data by clicking on the Preview button. the preview only allows for 100 rows of data, if there are more they will not be displayed in the Preview but will appear in your Export.
6/ Export a report
Happy with your Report? Export it in Excel to use if off-platform.
October 2023 Data Updates - Insights
🗓 Updates available starting October 2023
Launchmetrics continuously improves our data to help you get an exhaustive and up-to-date measure of your brand performance. Here is a recap of our latest improvements related to data that you will find in Insights & Discover.
✅ Online Media Updates
New Factors to Online Media Impact Value Formula
Launchmetrics has introduced new factors to our Online Media Impact Value formula which include:
- Number of Brand Occurrences - Provides a greater MIV depending on the amount of times a brand is mentioned within a single article.
- Distribution of Brand Occurrences - Provides a greater MIV depending on where a brand is mentioned within an article, such as the article title or consistently featured throughout.
Previously, all brands mentioned within a single article would receive the same MIV, but now each brand mentioned will receive its own unique MIV which better reflects the overall context of the article as it pertains to each brand.
For additional details on how this new branded Media Impact Value experience will impact both Insights & Discover respectively, please view these release notes:
✅ Social Media Updates
Media Impact Value formula for Chinese Social Media Channels
Launchmetrics has made a number of improvements to our Media Impact Value formula specifically for Chinese Social Medias. These include:
- RED - Boosting the importance of this channel, and increasing the weight of Audience and Engagement (especially “Favorites”) contribution to MIV.
- Weibo & Douyin - Increasing the importance of Engagement and decreasing the importance of Follower count as contributors to MIV.
- Douyin - Aligning the value of Douyin's top placements with TikTok's top placements.
- Fake Follower Factor - Introduced to reduce the MIV for profiles with “suspicious” audiences.
Beginning in October, we will recompute historical data for these channels from January 2023.
For additional details about these improvements to Chinese Social Media channels, please view this article: MIV Improvements for Chinese Social Media Channels
Audio to Text Content
Available now for both TikTok and YouTube, Launchmetrics now has the ability to monitor verbatim transcripts, which allows detection of brand keywords when mentioned in audio. Users can expect to receive more TikTok and YouTube placements.
For additional details about our Audio to Text content monitoring, please view this article: Audio to Text
Decrease in Available X/Twitter Profiles
Due to recent changes in the available API for X (formerly known as Twitter), Launchmetrics has been forced to reduce the amount of available X profiles in our database to 5,000 profiles. This amount has been reduced to only the most relevant Voices in the market.
🐞 Fix
YouTube Engagement
During the time period of February-July 2023, YouTube placements were affected by a lack of updates to Engagement metrics. This has since been resolved and all YouTube placements during this time period have had their Engagement metrics restored. Users can expect higher YouTube Engagement counts for placements from the time period of February - July 2023.
Engagement metrics are updated 3x during the first 30 days since the placement was made:
- 1st Update: 24 Hours after placement
- 2nd Update: 6 days after placement
- 3rd/Final Update: 22 days later from 2nd update. (30 days total)
This concludes the data related updates for October 2023. For any questions, we encourage you to reach out your Customer Success Manager or our Support team (support@launchmetrics.com).
Insights release / June 27th 2023
🗓 Released on June 27th
✨ Improved MIV (Online)
Online MIV formula is evolving!
We are now able to reflect the importance of the brand in the MIV computation. Until today, the MIV for an Online placement was attributed to all brands mentioned, they received the same MIV. With the new factors each brand mentioned receives a unique MIV.
Formula
With the Online MIV improvement, each brand mentioned in an Online article will receive a different MIV, thanks to new factors that were recently introduced:
Brand Occurrences - The number of occurrences of a brand within an article. The more occurrences a brand has, the higher its MIV.
Distribution of Brand Occurrences - The distribution or brand occurrences within crucial sections of an article now increases or decreases the MIV for the brand.
- If the brand is mentioned in the title it increases a lot
- If there are multiple brand occurrences the optimal distribution for the brand is an even repartition throughout the article
- If there is only one brand mention the optimal distribution is at the top of the article
These new features emphasise the importance of a brand's occurrence and distribution within the content and offer a more nuanced evaluation of its relevance. They also allow for a more precise understanding of a brand's performance within an article compared to the other brands in this article.
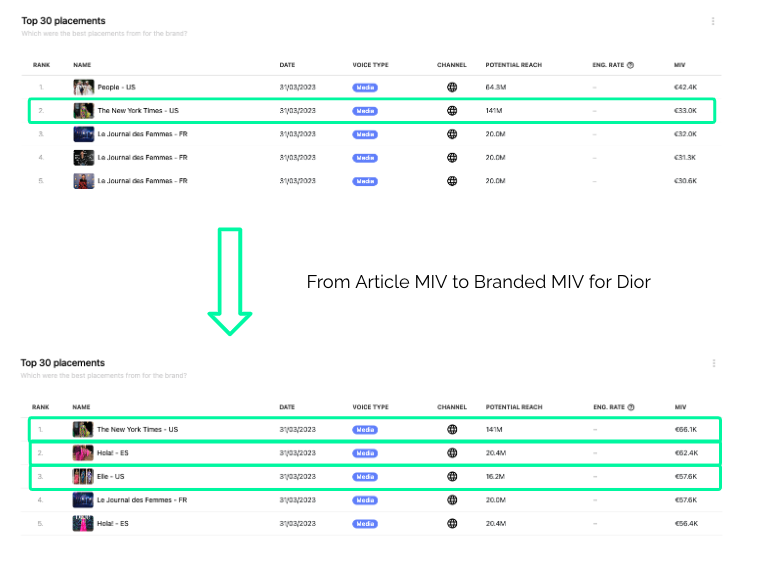
Impact
This Online formula change will have some impact on your MIV numbers and evolution. Globally the impact is minimal but at the placement level, it can be significant.
Below is an example of an Online placement from the New York Times for the brand Dior. The placement went from 33K to 66K MIV and from 2nd to 1st position for Dior for that period.
Data
This MIV evolution will not impact your YoY analysis and benchmark as we re-compute MIV past data from January 2022 with this change.
When the change is effective, all brand in your tenants will have their Online MIV change from the old one to the improved formula.
Data prior to January 2022 will stay unchanged.
Availability
Improved MIV is now available to all Launchmetrics users as Beta, you can request your CS manager to activate it in your tenant.
Insights Release / May 25th, 2023
🗓 Released on May 25th
✨ Download My Dashboard as PPT
Your own Dashboard is now available as a PowerPoint download. Set your filters and export from the Download all button to download a PowerPoint of all the graphs from this page.
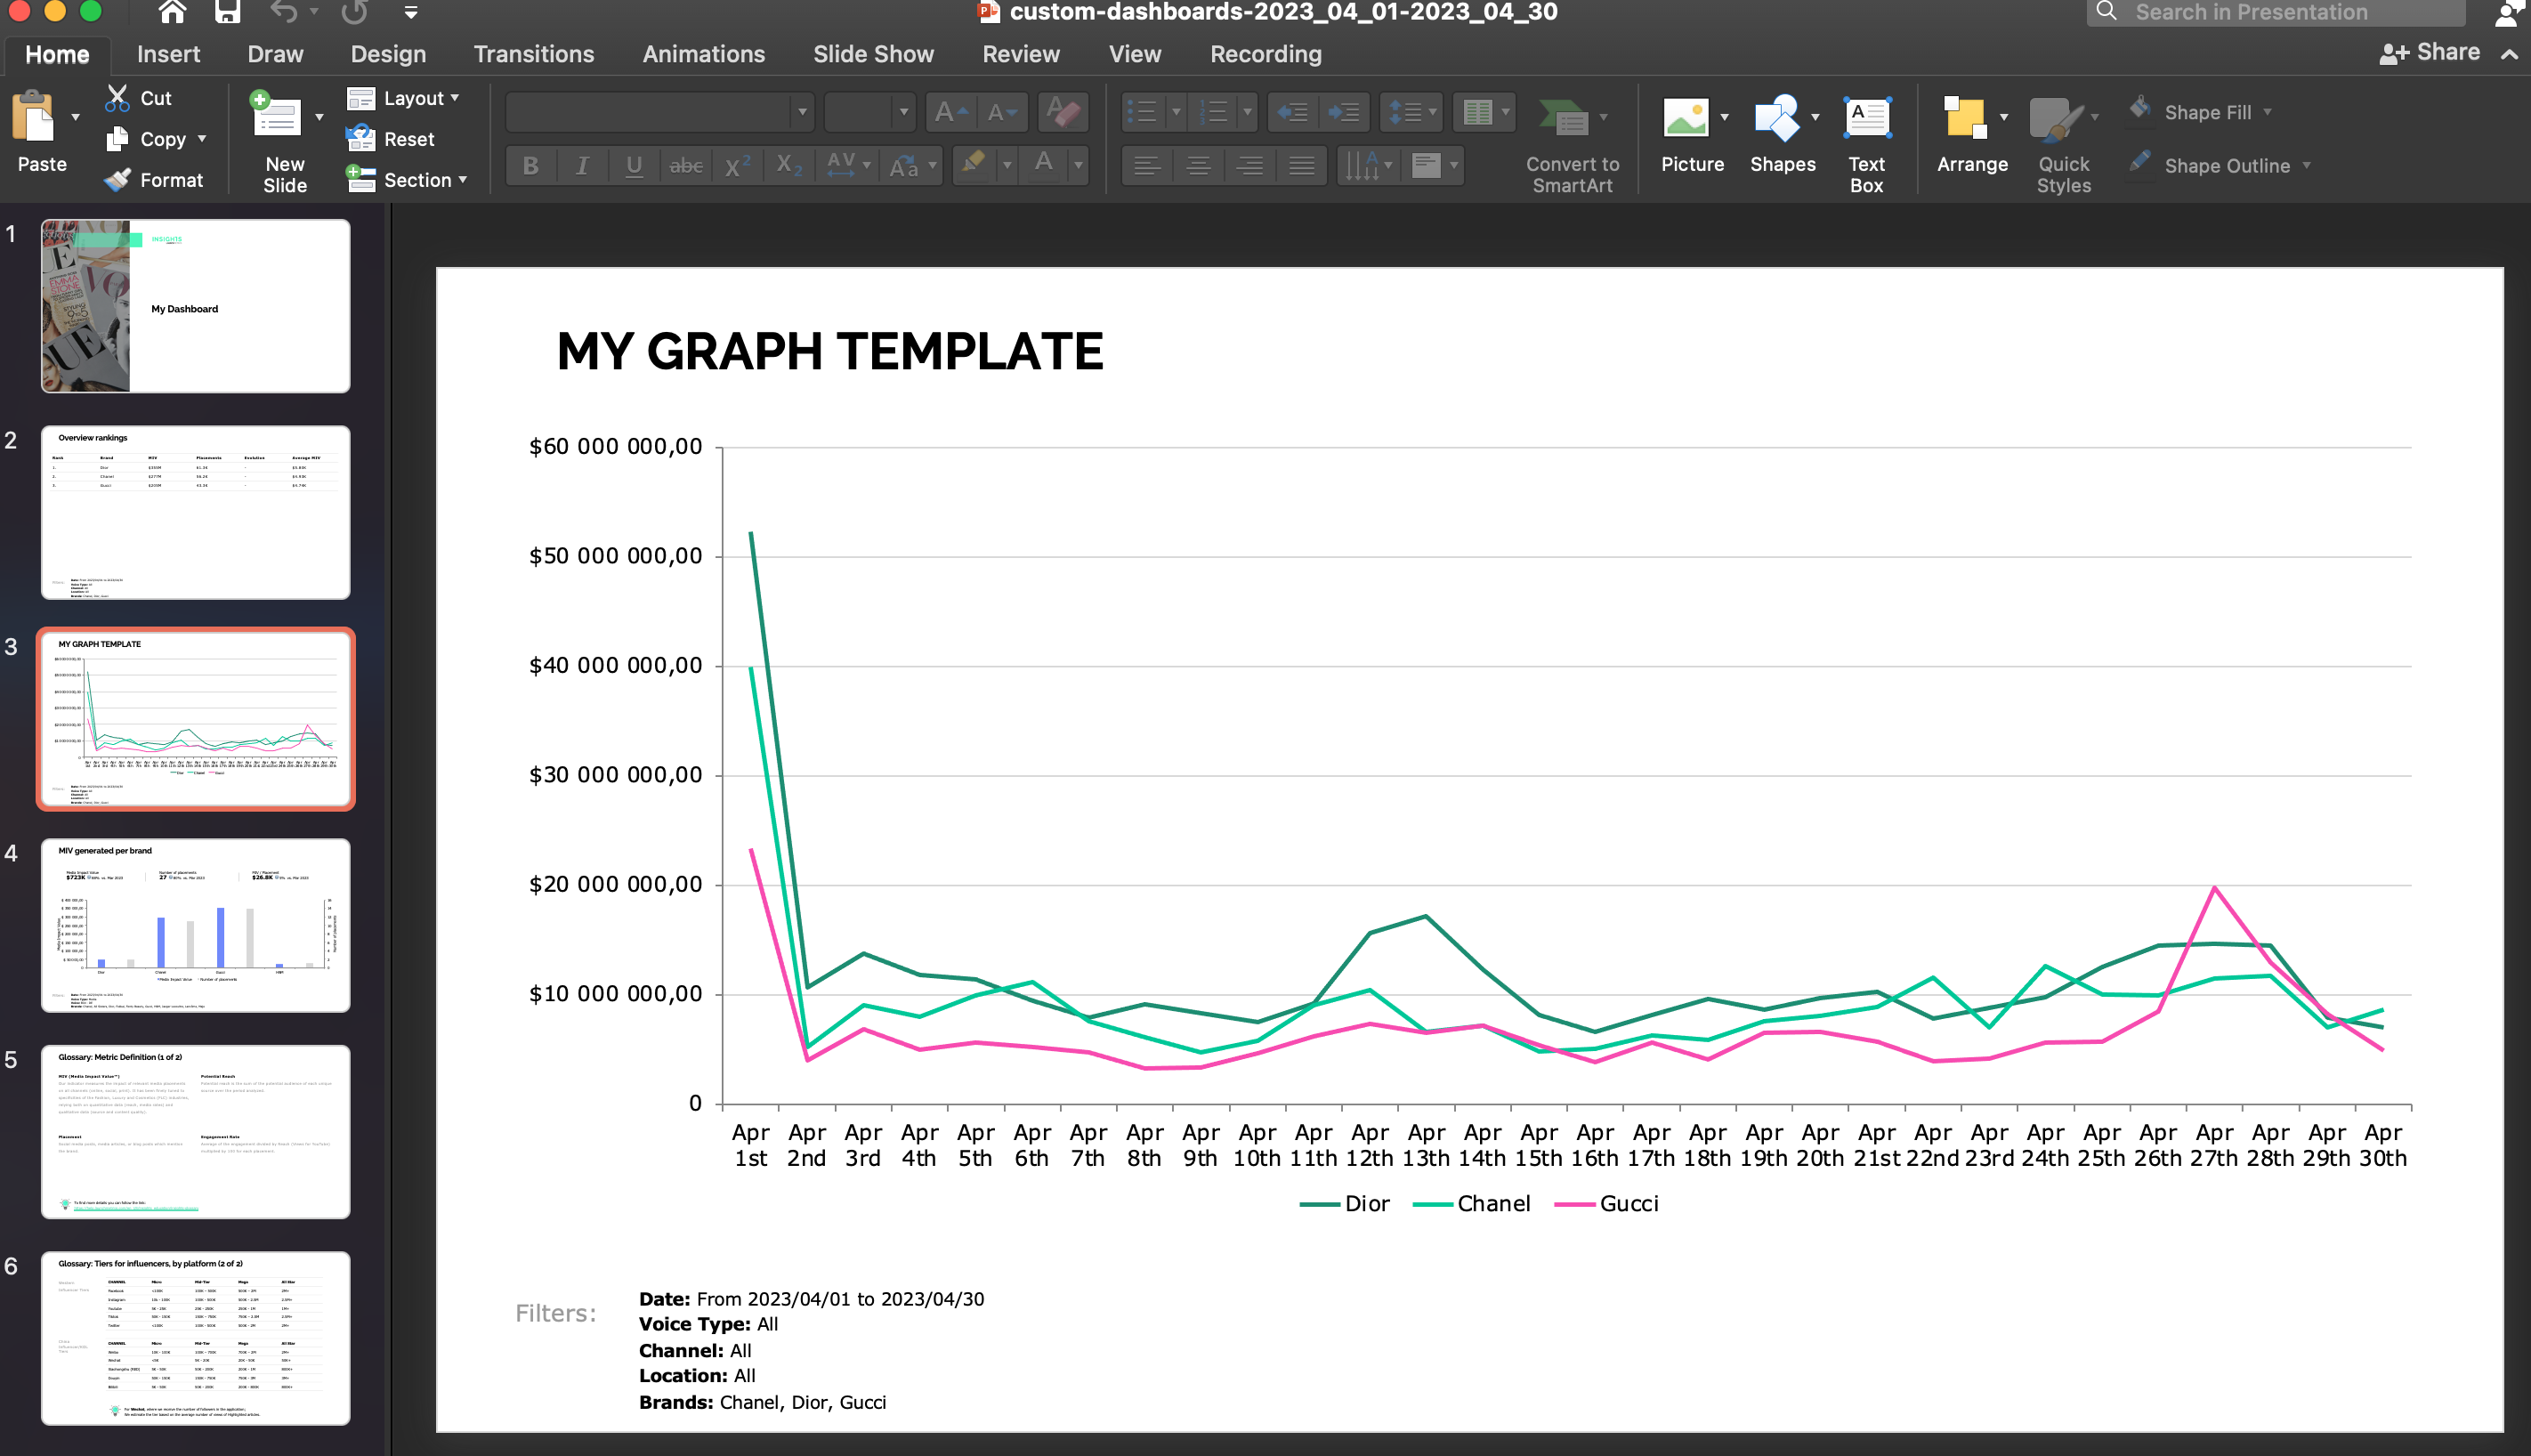
Pro tip
Customize the PPT presentation to your needs:
- change the font and colors to match your branding
- modify and clean data by editing it directly in Excel
- add comments to illustrate data points
Insights Release / May 17th, 2023
🗓 Released on May 17th
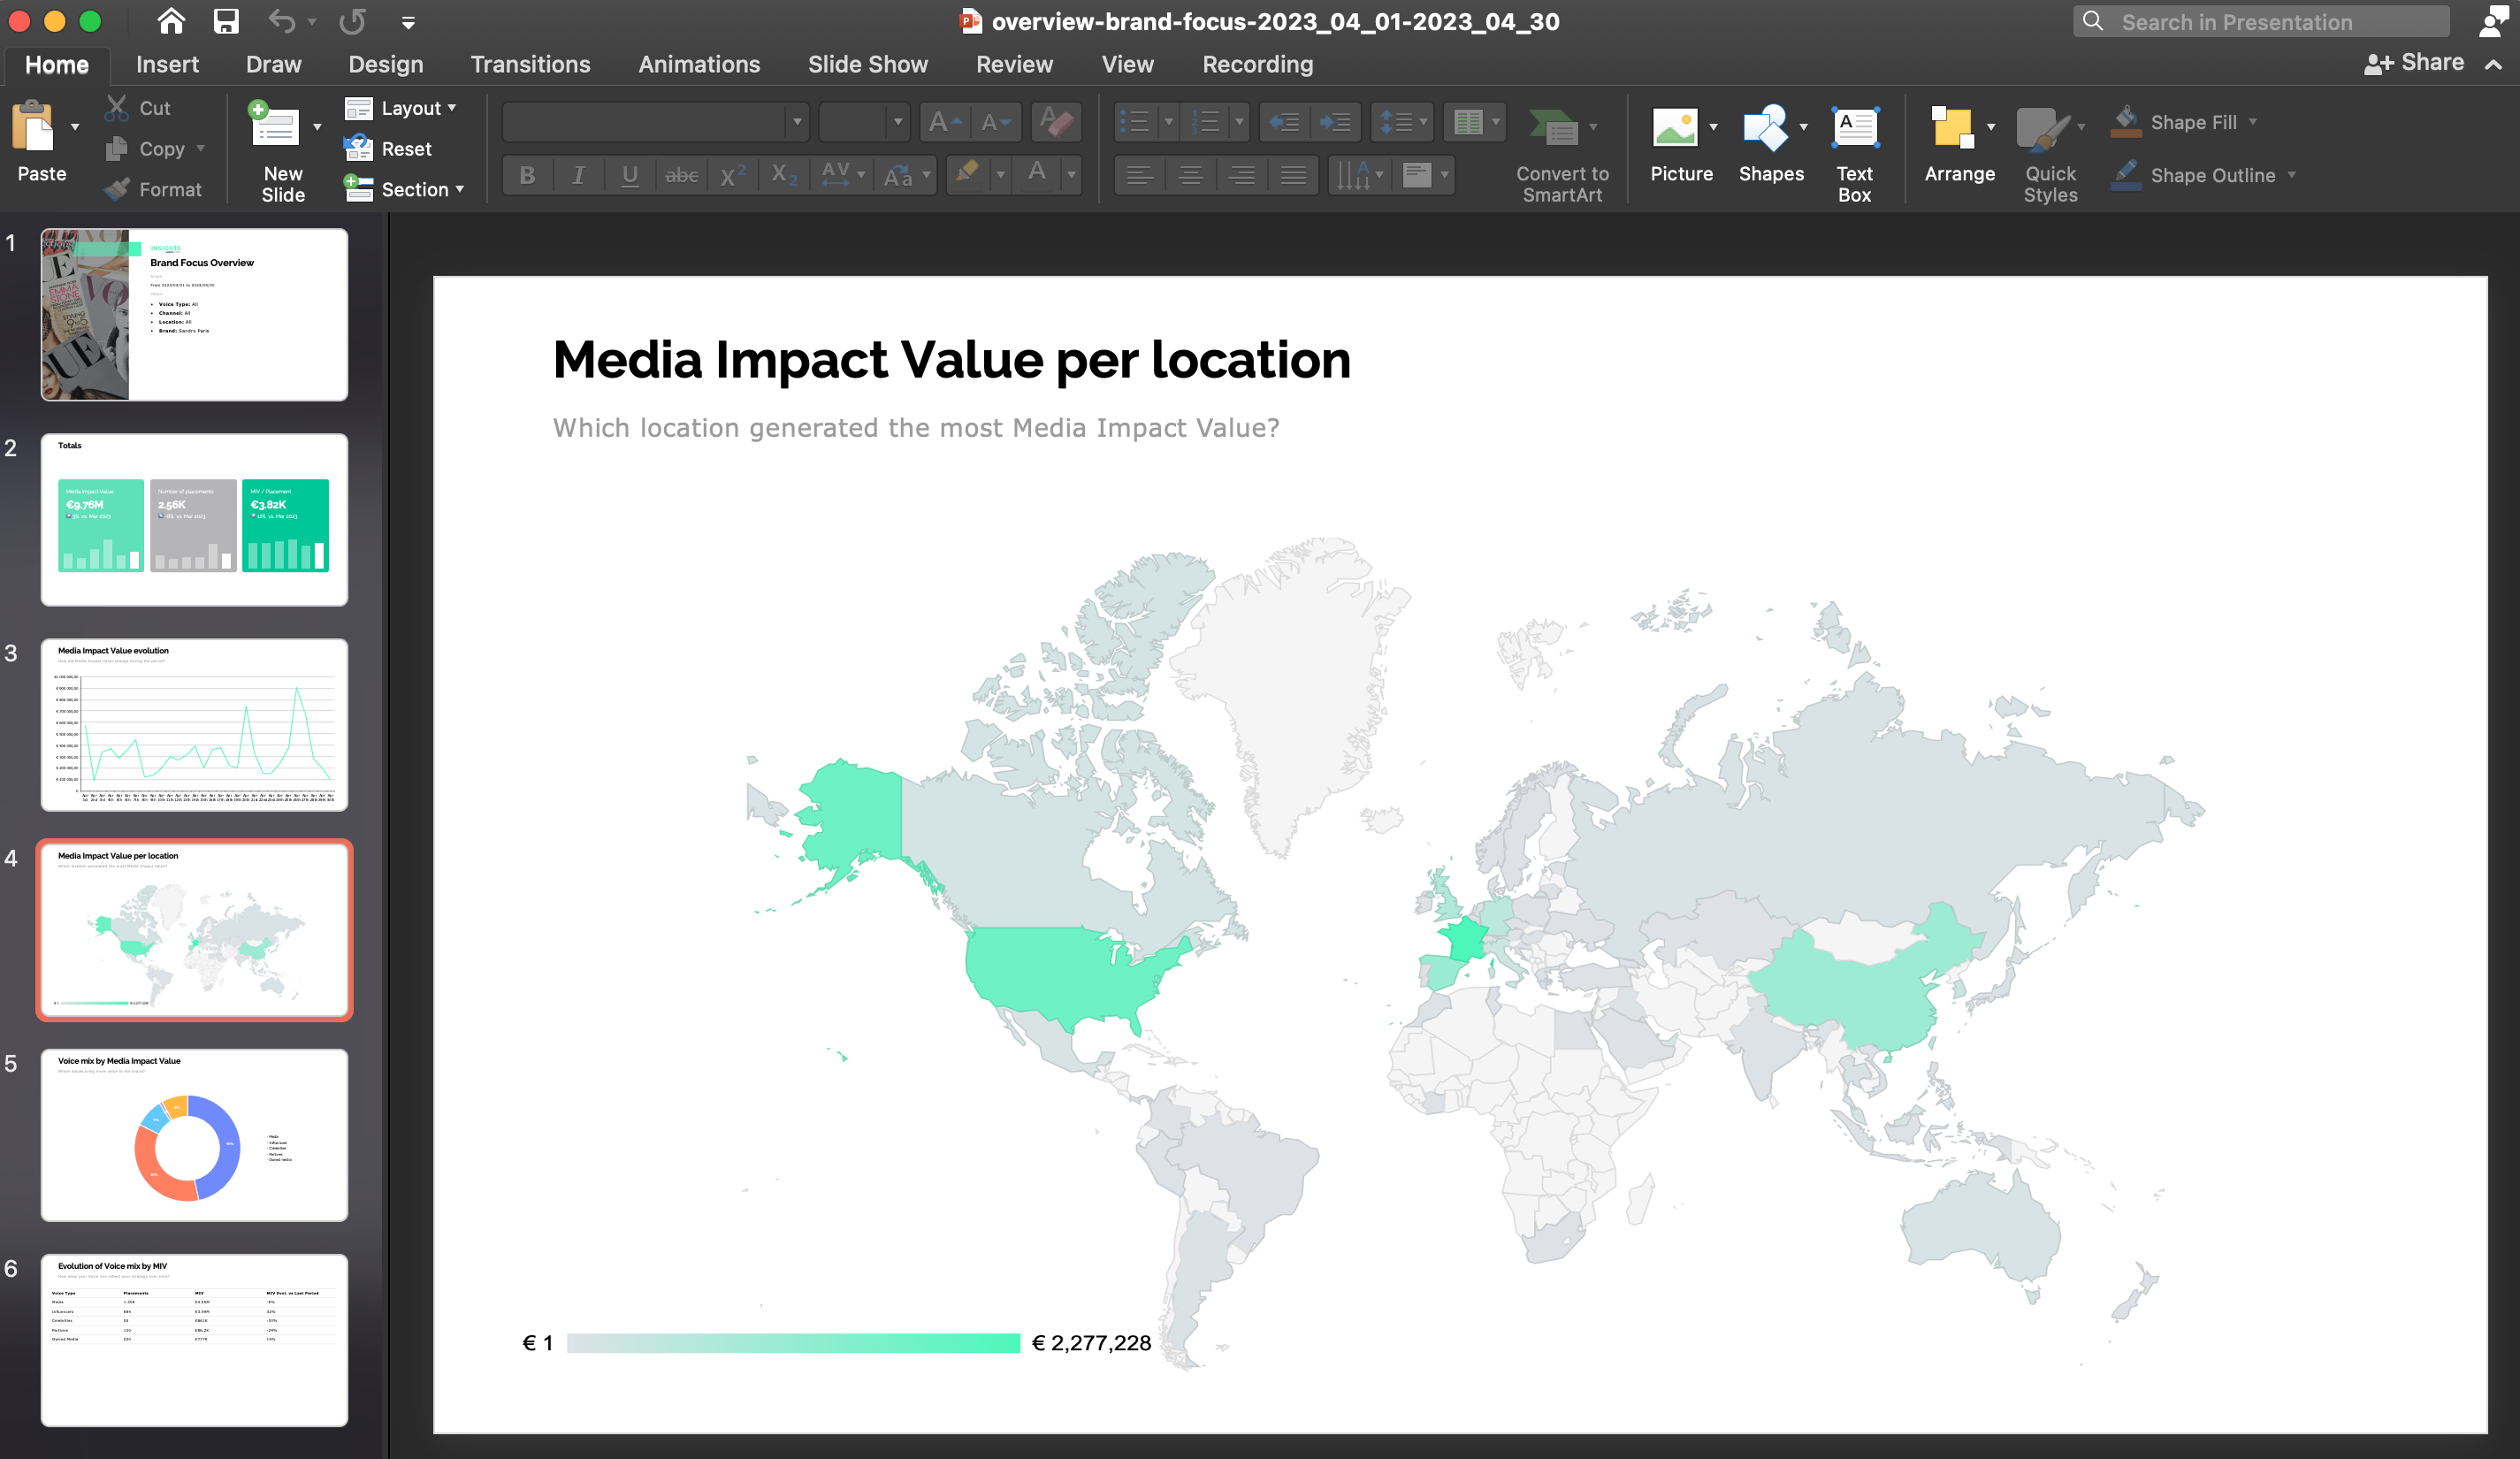
✨ Download Brands Focus and Voice Focus as PPT
Your Brands Focus and Voice Focus are now available as a PowerPoint download. Set your filters and export from the Download all button to download a PowerPoint of all the graphs from these pages.
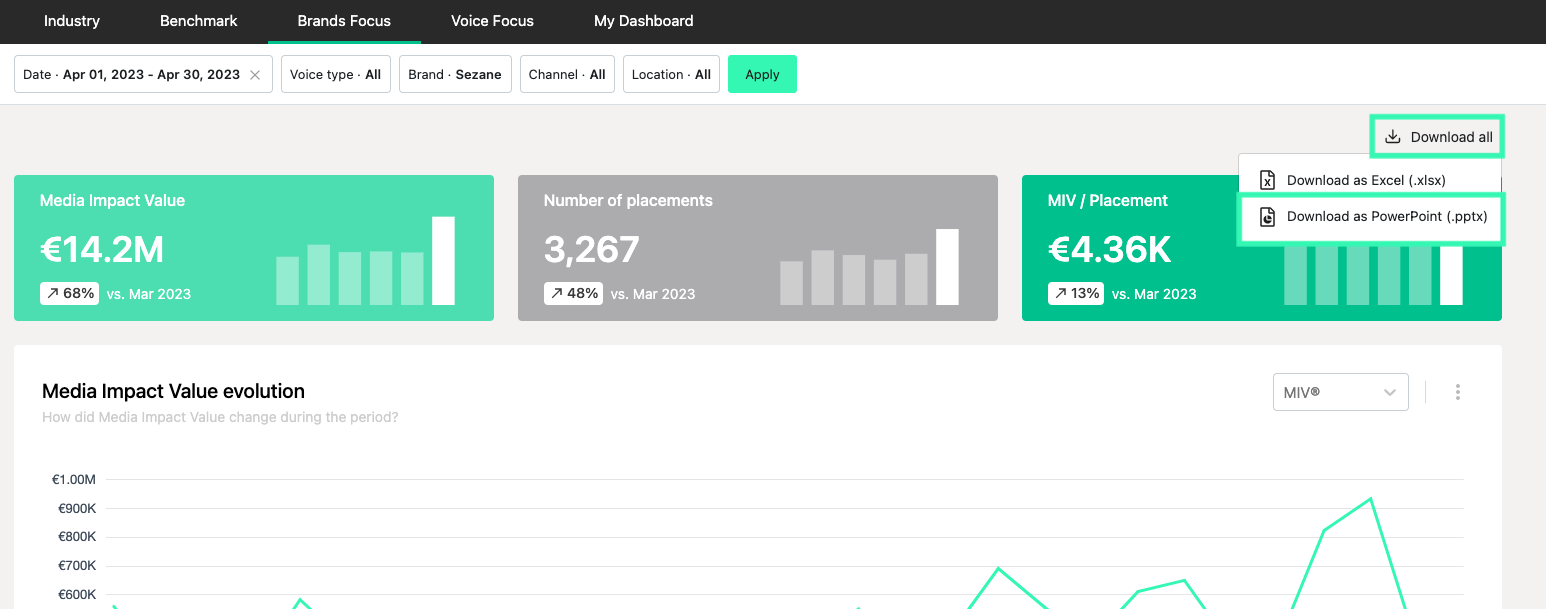
In a few seconds, the PPT is ready to use and share.
Pro tip
Customize the PPT presentation to your needs:
- change the font and colors to match your branding
- modify and clean data by editing it directly in Excel
- add comments to illustrate data points
“My Dashboard” tab PPT development is in progress. We'll keep you updated!
Insights release / April 2023 Data updates
We continuously improve our data to help you get an exhaustive and up-to-date measure of your brand performance. Here is a recap of our latest improvements and how to navigate them as you explore your dashboards and analyze your data.
Reach for Online placements
We will display figures related to the number of unique visitors instead of repeated visits to align with the industry and our customer's expectations. This will have no impact on MIV; as views are still used to estimate the impact of a placement.
This change happens on April 1st, 2023.
More Instagram accounts and additional fields
Expect a significant increase in social mentions and MIV related to Instagram with these new changes:
- addition of more than 20K Instagram accounts to our panel
- tap tags (brand mentions tagged in the picture/video/carrousel placements) are now monitored
- sponsored / "Paid Partnership" information from placements is now monitored
Longer updates for TikTok placements
We used to refresh engagement metrics to TikTok posts for 7 days after their publication. To better reflect the virality of this platform, we are increasing this to 30 days. Expect to see higher engagement figures and MIV!
Insights Release / March 25th, 2023
🗓 Released on March 25th
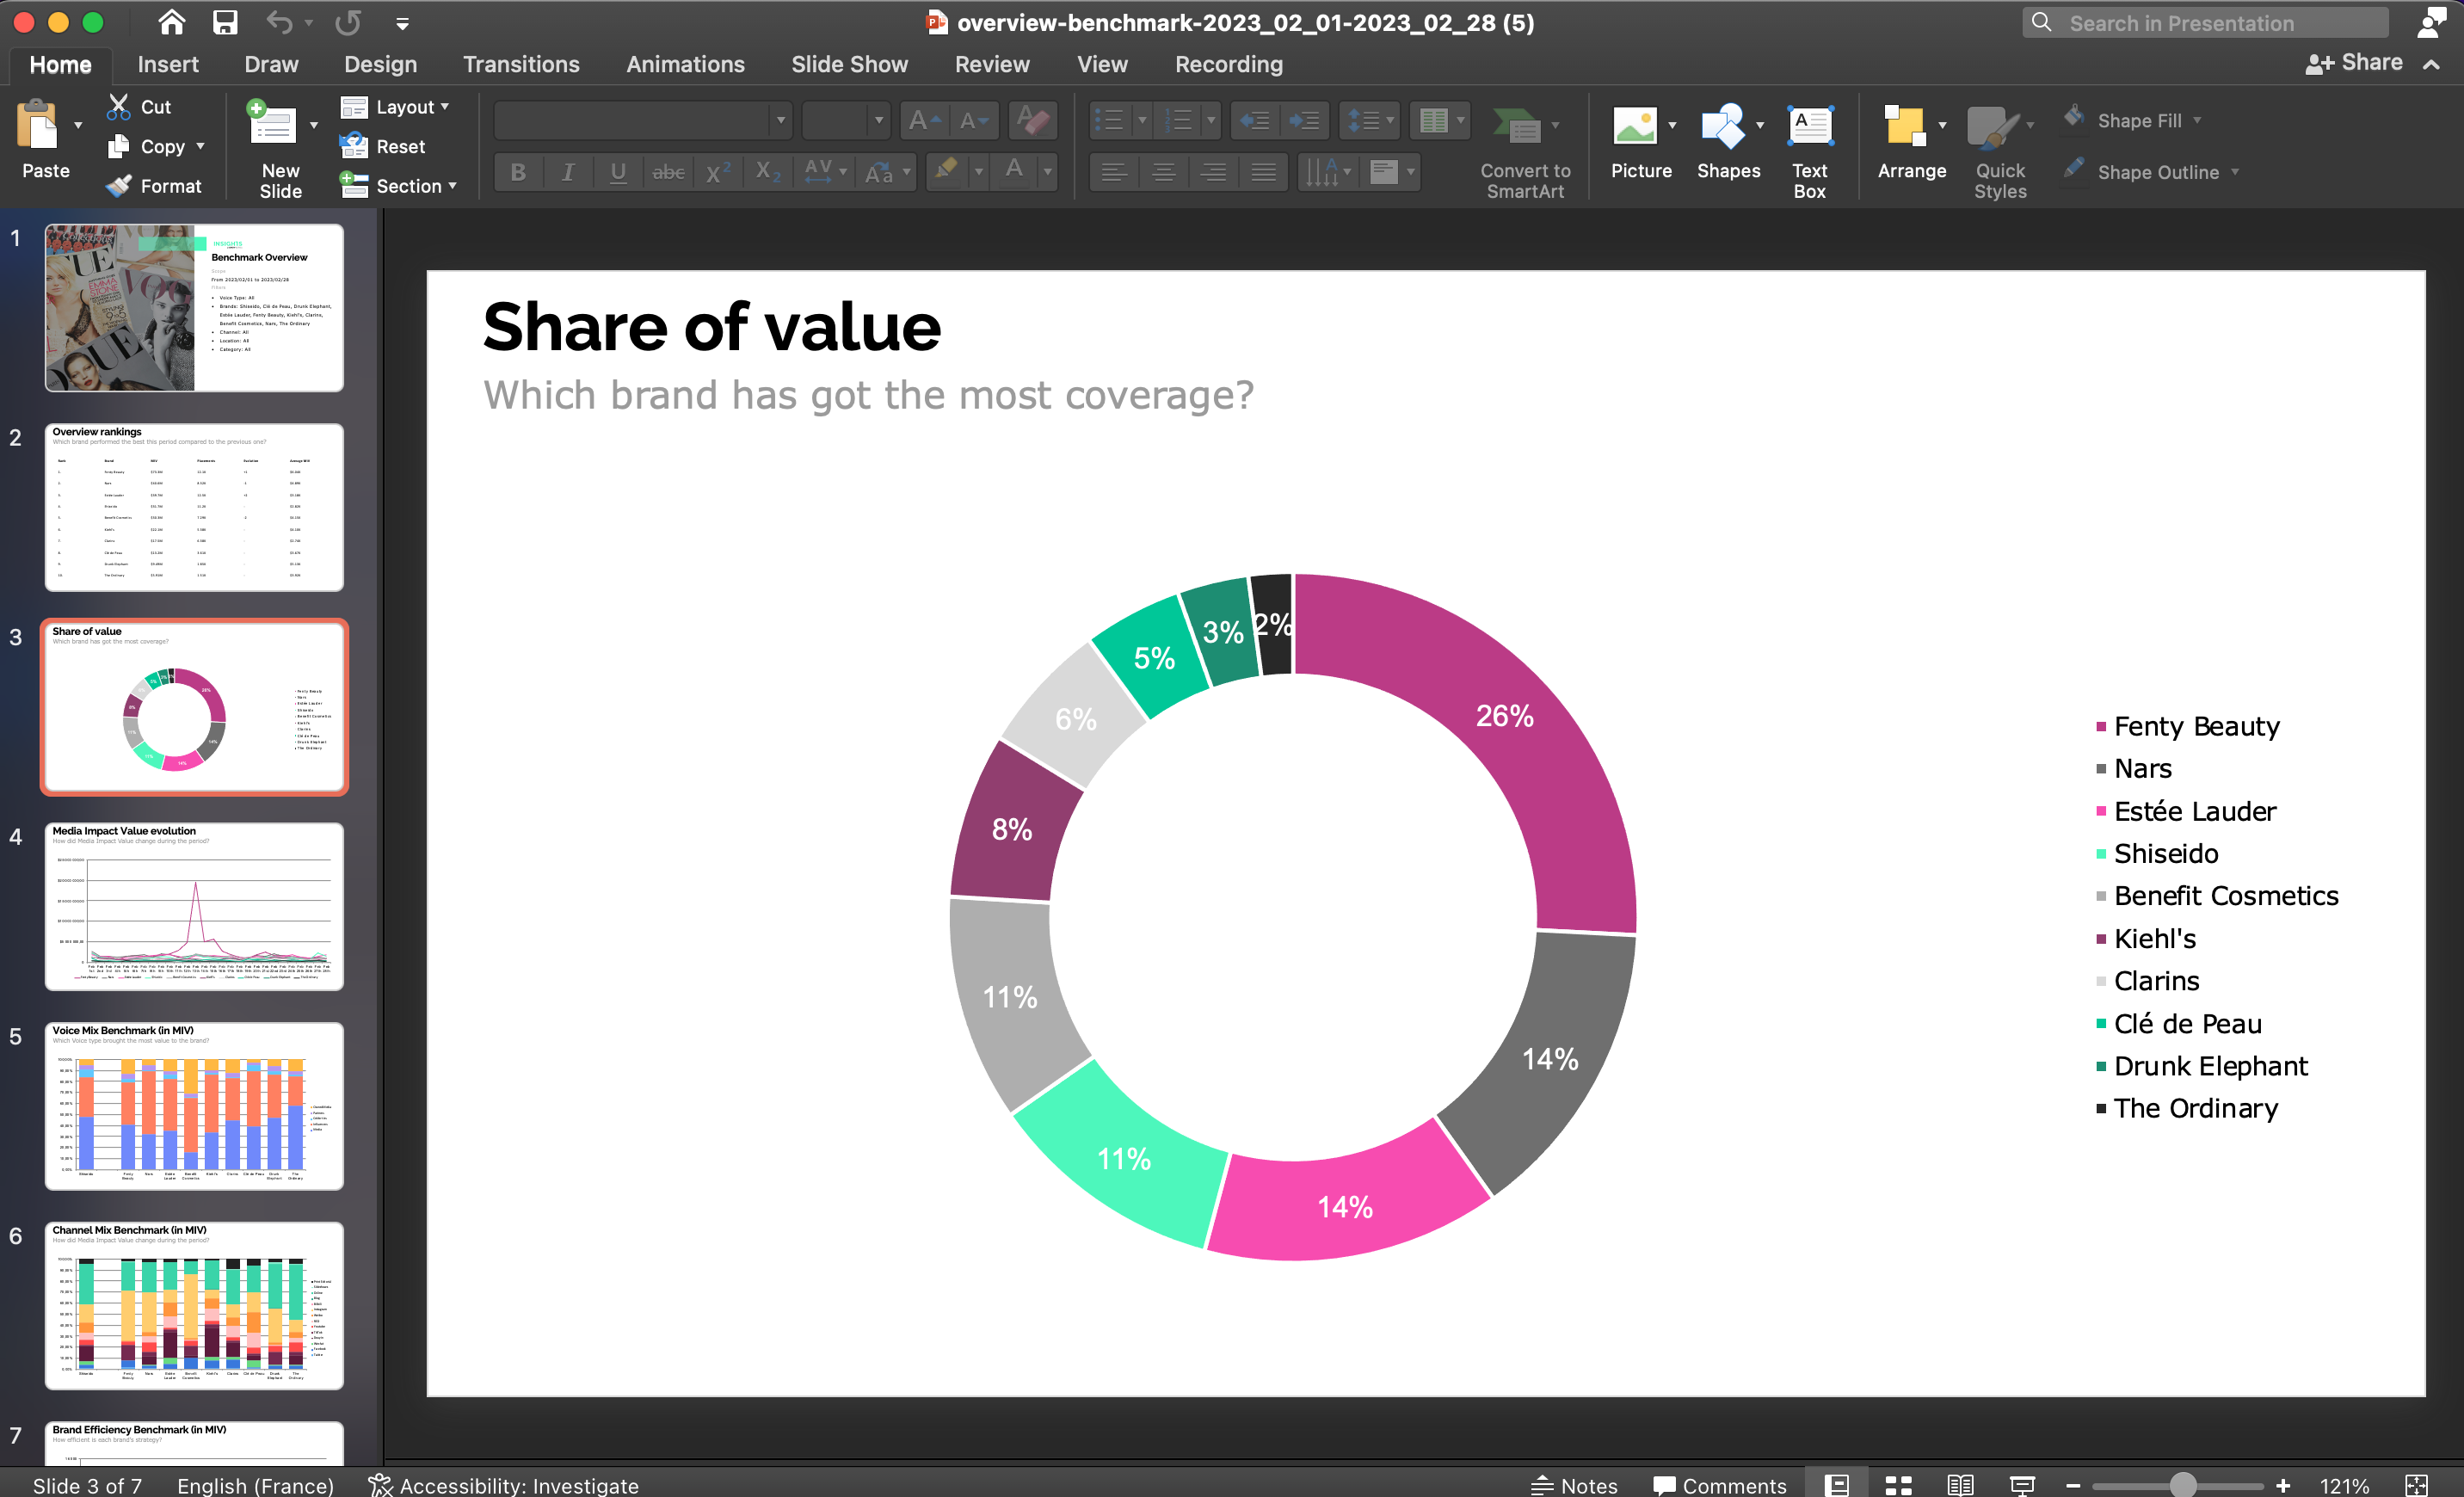
✨ Download Benchmark as PPT
Your benchmark is now available as a PowerPoint download. Set your filters and export from the Download all button to download a PowerPoint of all the graphs from the benchmark page.
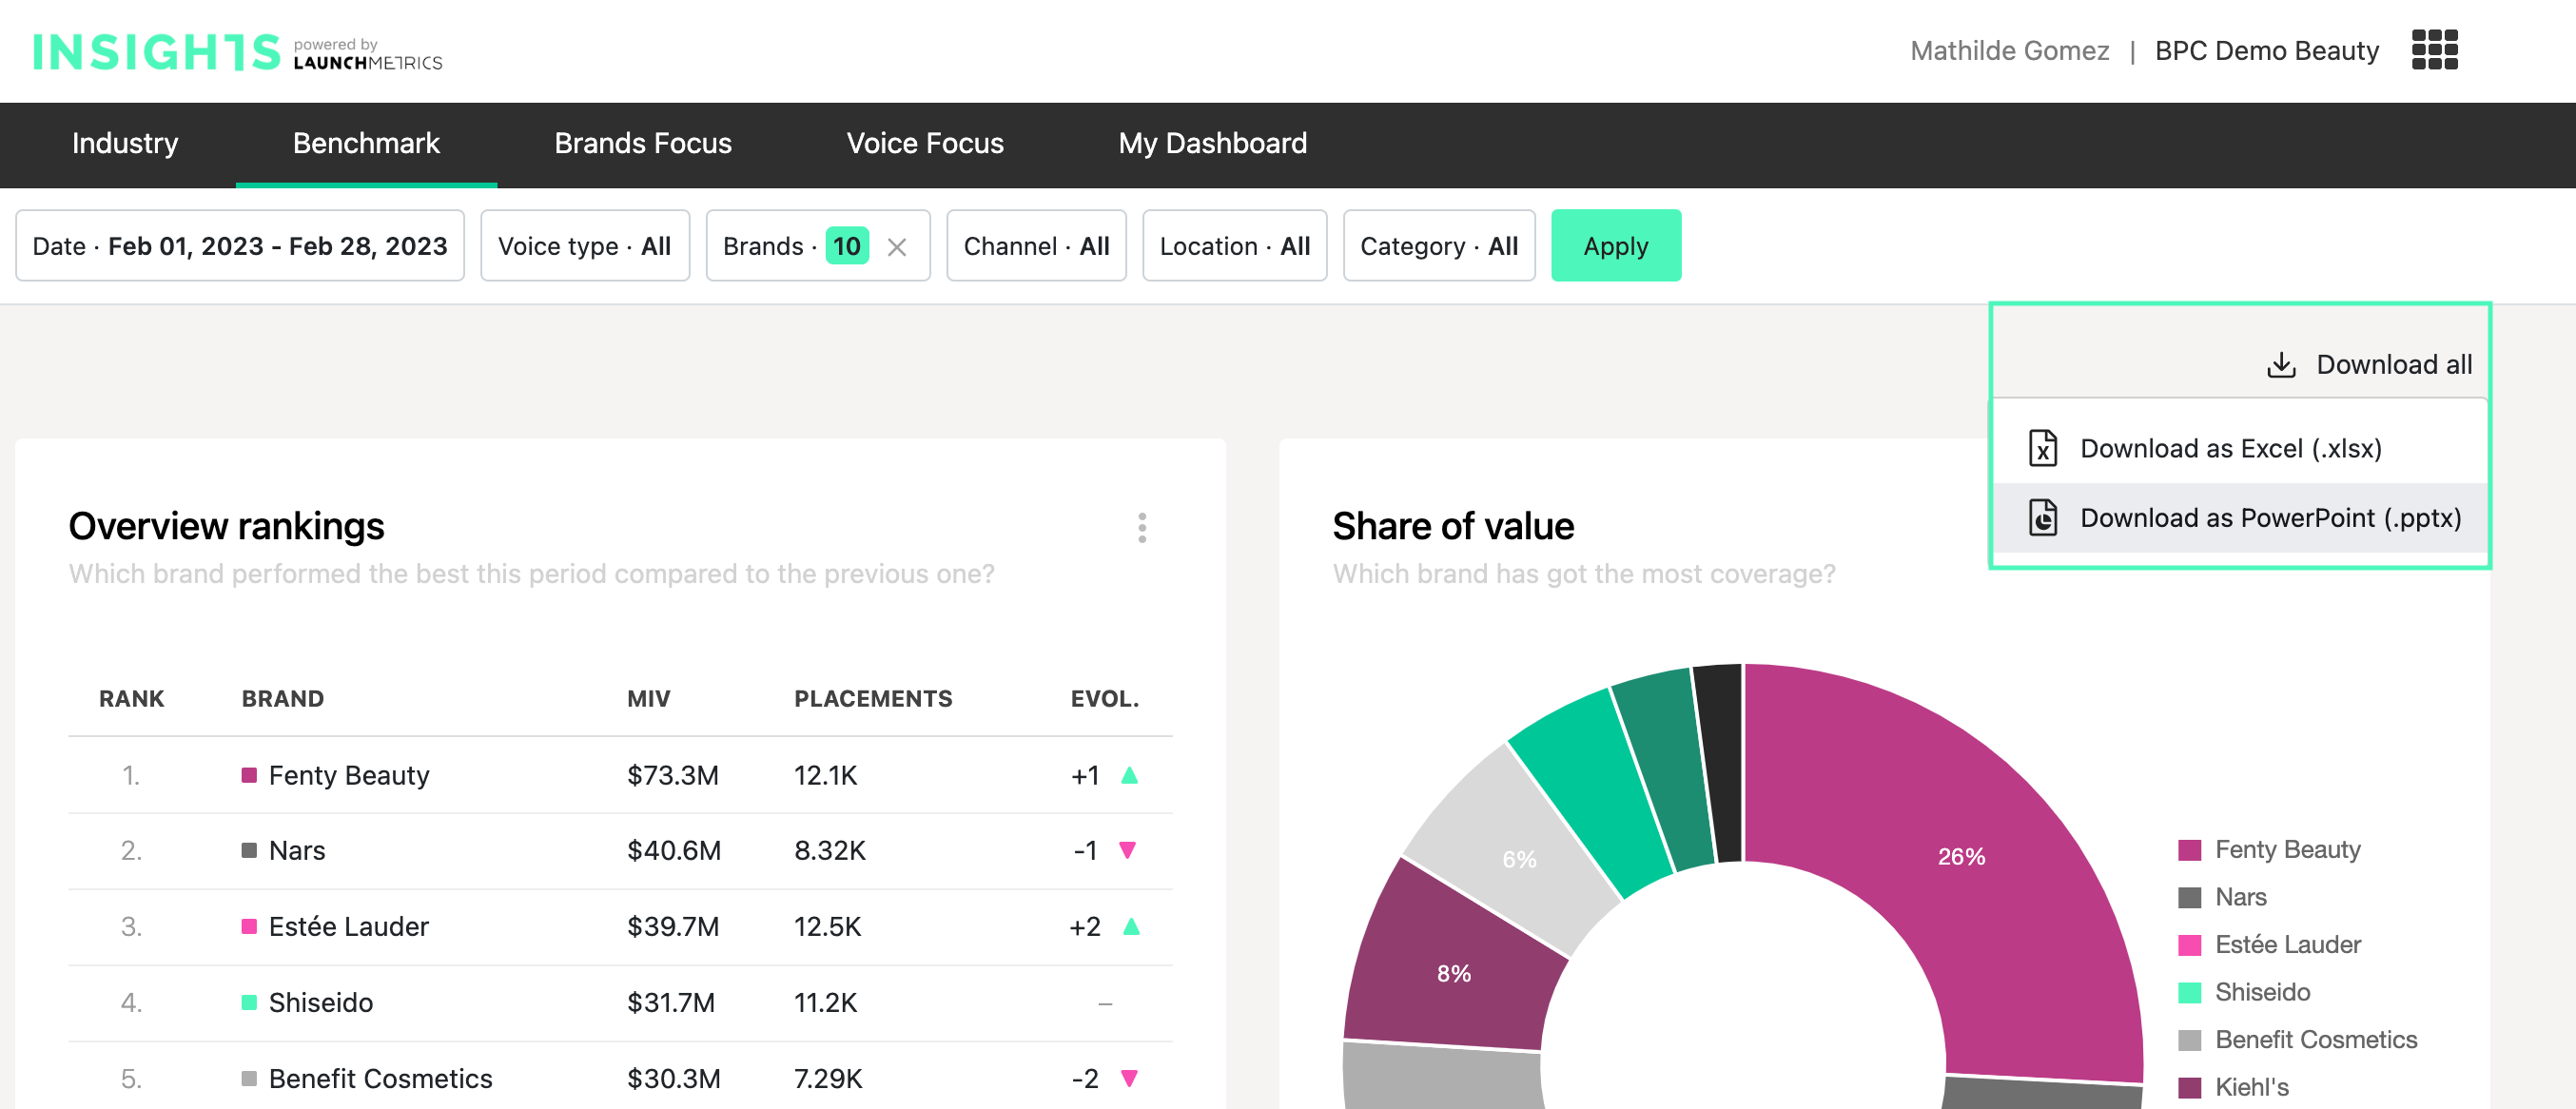
In a few seconds the PPT is ready to use and share.
Pro tip
Customize the PPT presentation to your needs:
- change the font and colors to match your branding
- modify and clean data by editing it directly in excel
- add comments to illustrate data points
The “Brands Focus”, “Voice Focus” and “My Dashboard” tabs are in progress. We'll keep you updated!
Insights Release / January 12th, 2023
🗓 Released on January 12th
✅ Set MIV currencies within your tenant
Modify your user settings to analyse MIV with the currency of your choice (USD, EUR, GBP, JPY, CNY).
Directly in your tenant you can choose the currency of the MIV displayed in Insights. Your preference is saved for your user and your next sessions.
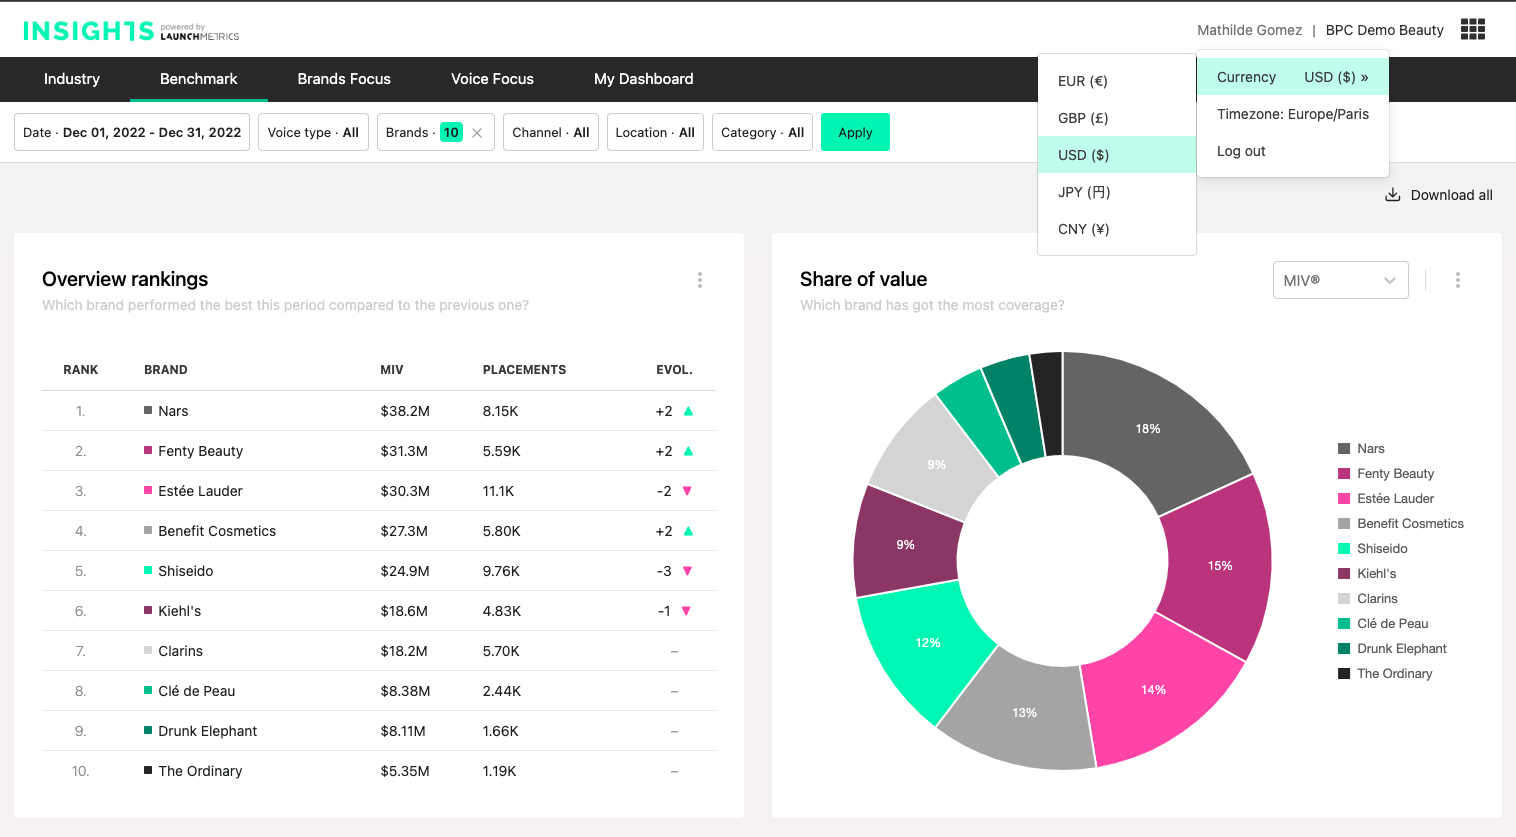
The setting is saved at user level, meaning it's not taken into account for the other users of the tenant. This gives you the flexibility to have different settings than the rest of your team.
Insights Release / December, 15th 2022
🗓 Released on December 15th
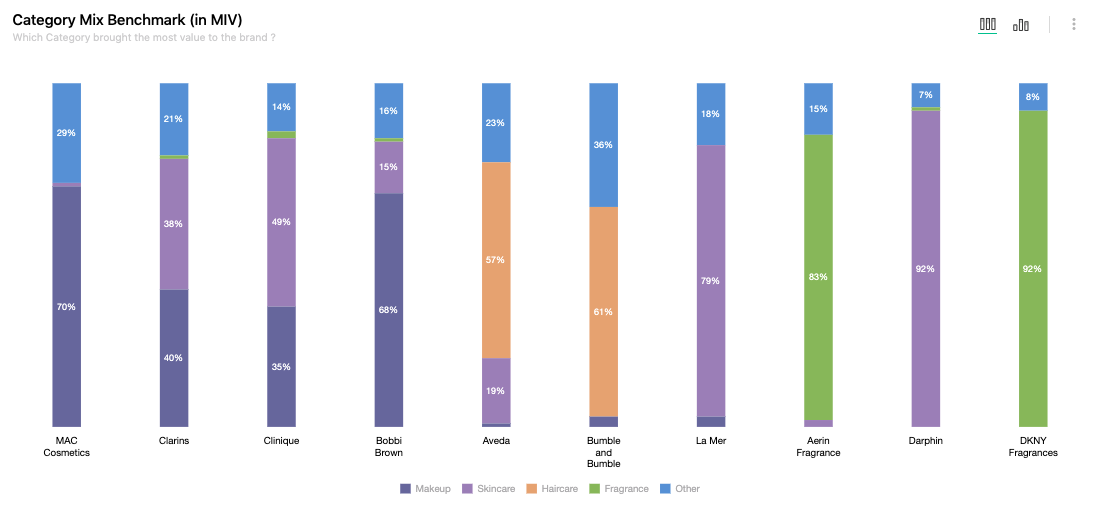
✨ Categorization for Beauty brands
As a beauty brand it's important to have various analysis levels to analyse your brand performance. The category tagging provides this added granularity that makes your analysis even more relevant.
The categorization feature in Insights allows you to benchmark your brand performance per beauty category (makeup, skincare, fragrance, haircare).
Pro tip
This feature is useful if:
- you're a single-category brand and would like to benchmark your brand performance against a multi-category brand; Nars and Dior makeup
- you're a multi-category brand and would like to analyse the results of a specific vertical; makeup vs skincare
The Category filter enables you to filter all your dashboards by category, combine some categories together or exclude them from your analysis. By default, all categories are selected.
Categories
There are five beauty categories (Makeup, Skincare, Haircare, Fragrance and Other) to qualify placements.
“Other” category tag gathers two types of mentions:
- Products classified as cross-category sets
These are all products that servie more than one category
- Brand mentions not associated to beauty products
E.g., corporate mentions, financial reports, brand history (founder’s birthday/fun facts), charity related posts, employee insights.
Data
Placements can be tagged with multiple categories if they mention more than one product or more than one brand.
This means that if you sum the numbers from multiple categories you may have a total higher than the total number of placements.
This also means that even though you would only have “Makeup” in your filter selection, it's possible to have results of placements that are tagged with another category.
This filter enables you to understand category trends and have some high level analysis but not to do category mix.
Interested is this add-on?
If you're a Beauty brand interested in the Categorization to benchmark your competitors in Insights please contact your CSM.
Insights Release / October 24th, 2022
🗓 Released on October 24th
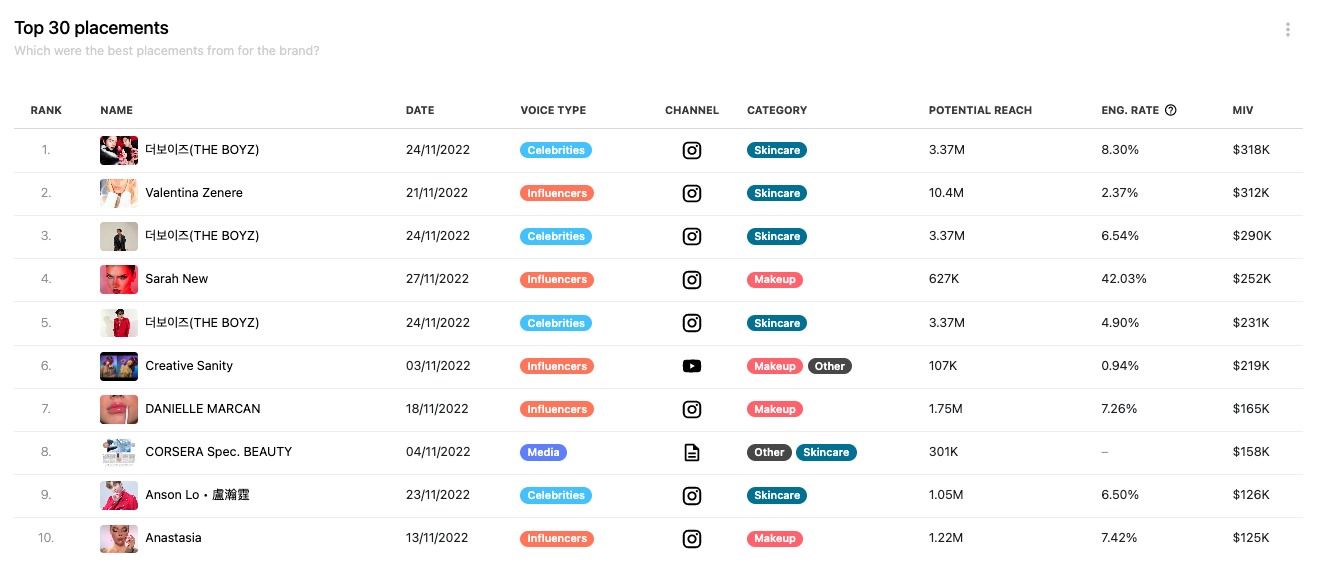
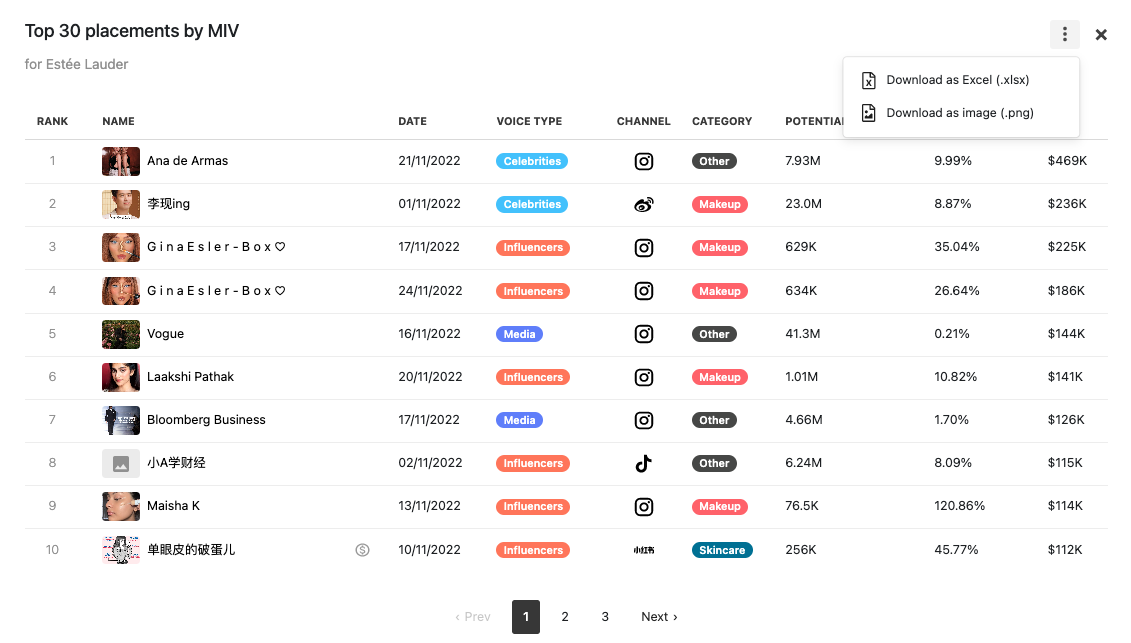
✅ Download “Top 30 placements”
Benchmark your brand performance in Insights and share relevant data points with your teams.
You can now download any “Top 30 placements” table from your dashboards in both Excel or image format.
Insights Release / October 31st, 2022
🗓 Released on October 31st
✅ DMR Print data migration completed
Launchmetrics solutions now have one consolidated Print media reading list
- Clients will benefit from a 56% overall increase in Print publications.
- 910 new titles have been added, including 100+ top global newspapers and 11 new countries.
- APAC Region is the one where coverage has increased the most due to the migration
- Timings of delivery will improve, in particular for APAC and Middle East
Print MIV methodology updated
- On average, Media Impact Value will grow due to both panel size increase and methodology changes.
- Overall page occupation will tend to grow
- EMEA Region is impacted in terms of MIV growth mostly due to Italian Print Media now using Gross Economic Value for its advertising rates.
- Beauty is the most impacted industry, alongside Jewelry & Watches.
Insights Release / October 5th, 2022
🗓 Released on October 5th
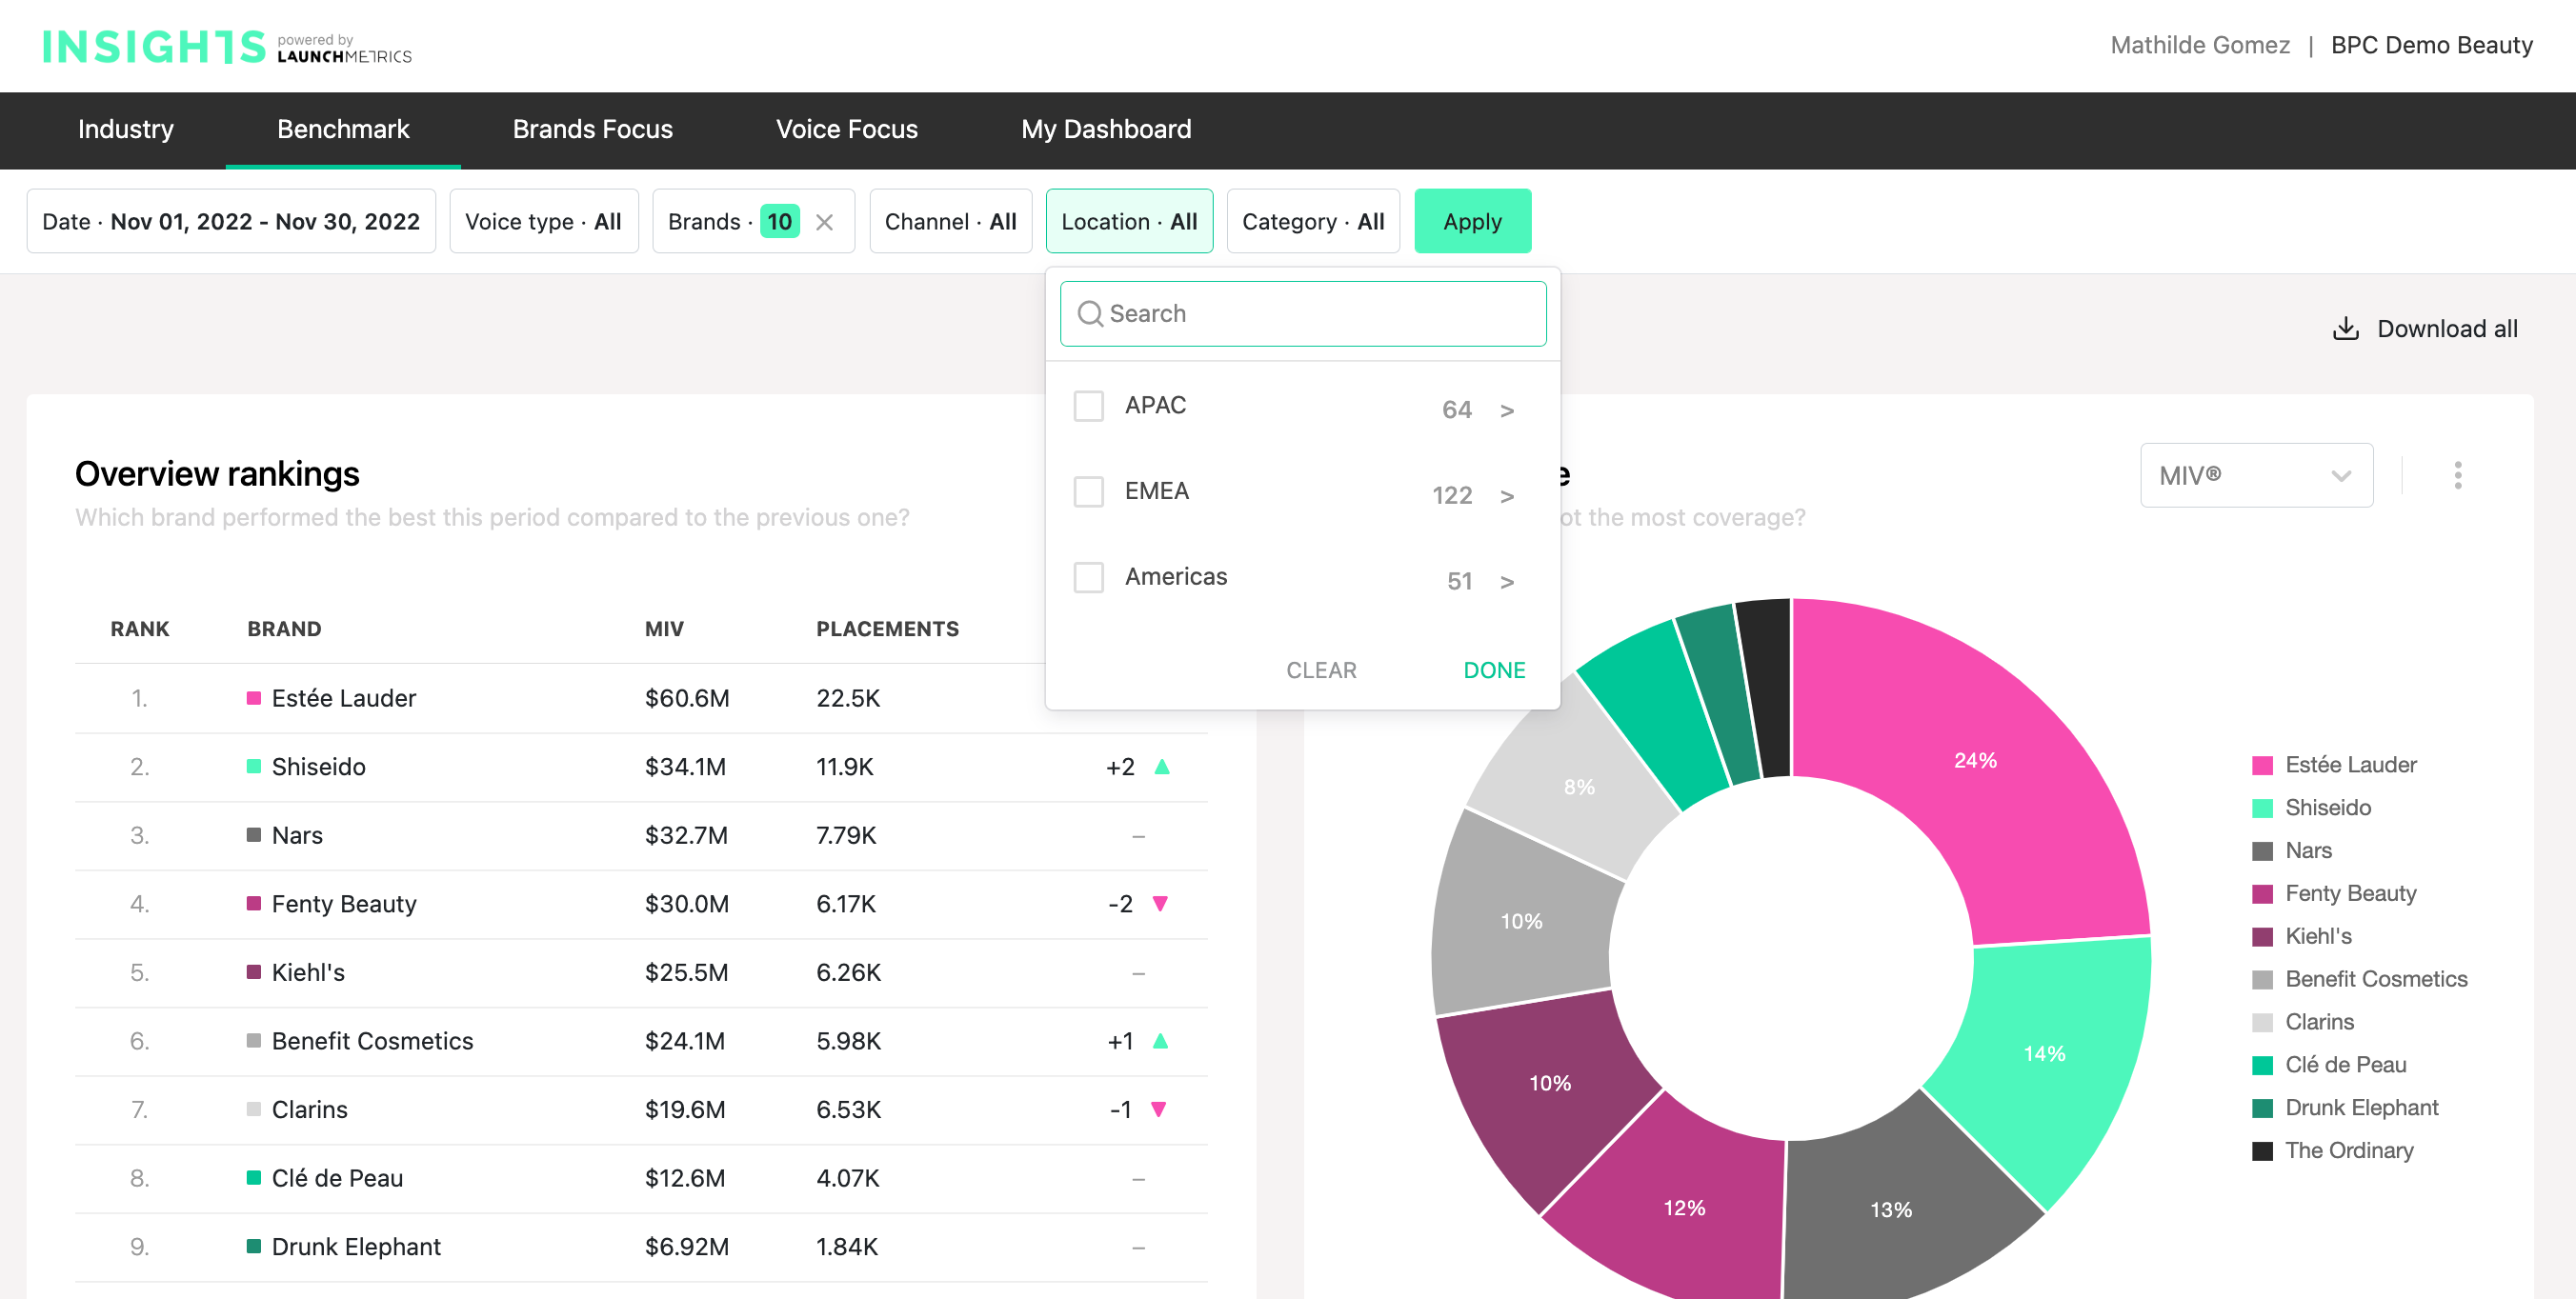
✅ Location Filter: Region
You now have the ability to use the Location filter to filter your dashboards by regions (APAC, EMEA, Americas) and not only by countries.
This feature enables you to select a group of countries in one click and to perform your analysis based on specific markets.
Insights Release / April 12th, 2022
🗓 Released on April 12h ✨ Categorization for Beauty brands As a brand it is impo...
🗓 Released on April 12th
✨ Categorization for Beauty brands
As a brand it is important to have various analysis levels to perform strategic benchmark. The category and product type tagging provides this added granularity that makes your analysis even more relevant.
.gif)
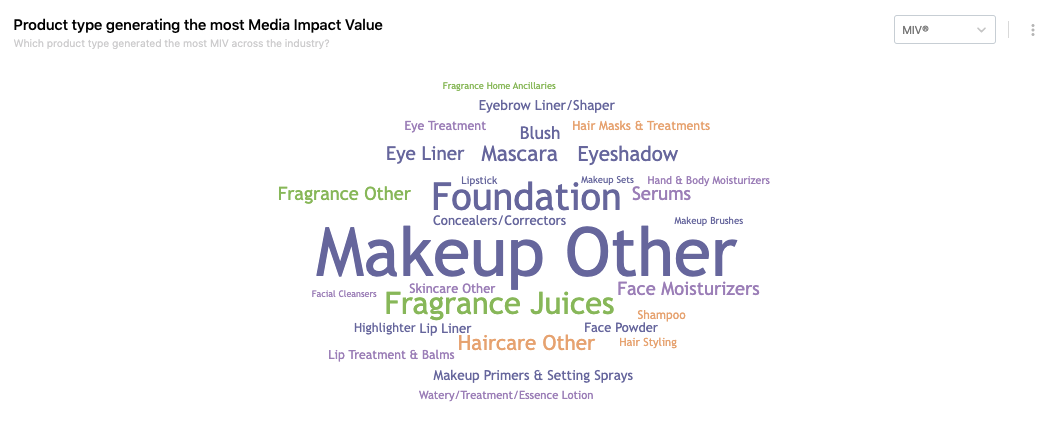
The product categorization feature in Insights allows you to benchmark your categories and product types within your industry and with other brands.
This level of granularity enables you to perform industry analysis by filtering on specific categories, but also compare Voice mixes and Channel mixes by category with your competitors. For multi-category brands you can identify the categories and product categories that drive the most MIV for your brand and your competitors.
Category and product type
There are five beauty categories (Makeup, Skincare, Haircare, Fragrance and Other) that each have product types (blush, shampoo, moisturizer etc). Each brand and product mention in a placement is analyzed in order to be tagged with one or multiple categories and product types.