
🗓 Released on October 20th
✨Report (beta)
Build your own Report with Insights new powerful feature in 6 easy steps:
1/ Filter the data

Refine your analysis by filtering your data with the filters available. You can find the usual cross-channel Insights filters as well as new ones specific to Print:
- Events
- Placement Type
Editorial, Advertising, Advertorial: by default, only Editorial is selected to align with the rest of the platform - Sectors
- Lines
- P lines
- Product names
- Publishers
- Magazines
2/ Group by dimensions
Aggregate your data by different dimensions to get the right answers.
If you toggle “Show subtotals” there will be subtotals for each of your groups.
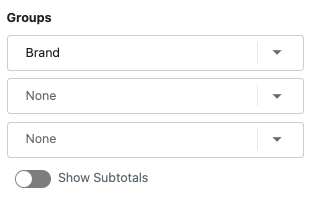
- Brand
- Channel
- Channel Type
- Voice Type
- Voice Name
- Magazine
- Location
- Event
- Publisher
- Sector
- Product line
- Line
- Product name
- Year
- Month
3/ Select metrics
Choose the relevant metrics to track for your analysis. By using “drag and drop” you can change the metrics order to make your report look exactly as you wish.
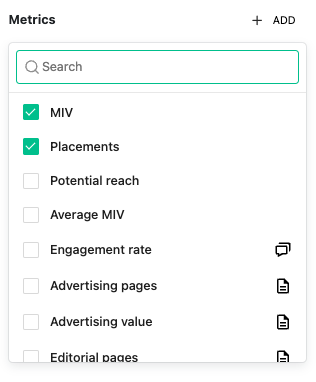
- MIV
- Placements
- Potential Reach
Circulation for Print, monthly visitors for Online and followers for Social. - Average MIV
- Engagement Rate
- Advertising Pages
Total number of paid advertising pages, including Advertorials. - Advertising Value
- Editorial Pages
The equivalent of all editorial credits in total pages (space occupied on the page). (¼ + ¼ + ⅔ = 1,16 Edi pages). - Editorial Value
- Cover Placements
- Full Page Placements
- Page Ratio %
- Monetary Ratio %
- Editorial Number
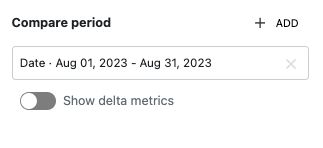
4/ Compare date periods
Select one or two periods to run a comparison. Pick any date you want with the date picker to refine your analysis.
To see the evolution of your metrics toggle “Show delta” and choose the metrics you want.
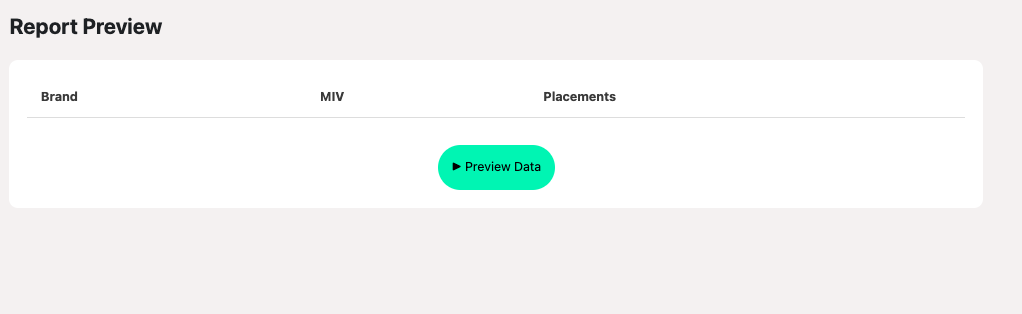
5/ Preview the template
At any point while building your Report you can Preview the data by clicking on the Preview button. the preview only allows for 100 rows of data, if there are more they will not be displayed in the Preview but will appear in your Export.
6/ Export a report
Happy with your Report? Export it in Excel to use if off-platform.