
Case study for Voice Focus pages
Note:
- Voice filter is applied to all graphs of your dashboard. Please keep this in mind when doing your analysis.
- All graphs are clickable, when clicking you will get a view of the top 10 placements for the scope analyzed in the graph (specific date, voice type, etc).
- All graphs are available to download in excel
Main KPIs

MIV: Total MIV for the Voice chosen (in Media, Influencers or Celebrities) during the period (date filter).
If the date you asked for is a month, it's compared to the previous month and if you select custom dates, it's compared to the same number of days preceding your date selection. Ex: If you select November 1st to November 30th, it will be compared to October 1st to November 31th.
Analysis tips: The MIV here is the total MIV generated for all brands together. It's not always a good news if the number is high but the number for your brand is low.
Number of placements : Total number of placements (articles, posts) posted by this voice about the different brands in your competitive set on the scope of your filters.
MIV/placements : Average MIV per placement (total MIV divided by total number of placements).
Analysis tips: if the average MIV you get from the influencer is higher than this it means the influencer is overperforming for your brand versus the others
MIV Generated by Brand
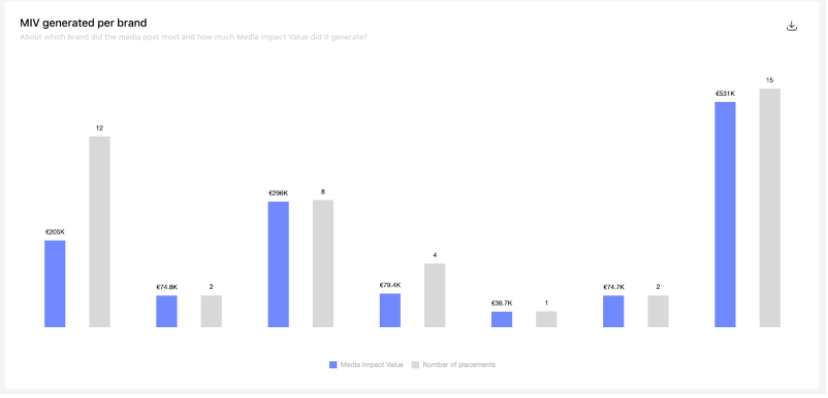
This bar chart is available for Media, Influencers and Celebrities. It displays the MIV generated versus the number of placements for each brand by voice (selected in the filter).
Print advertising vs editorial placements
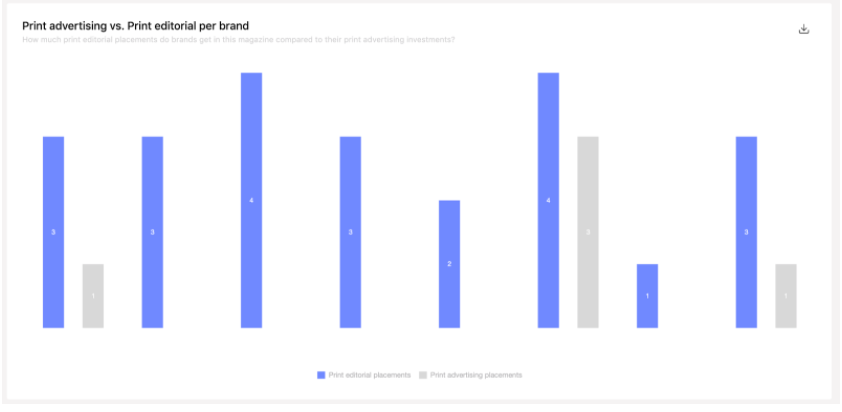
This bar chart is only available for Media Voice type. For media who have print outlets you'll have a comparison for each brand of the number of print advertising placement (and not pages) and print editorial placement (and not pages). This is to help explain better why a media may advocate more for one brand or the other.
Top 10 placements
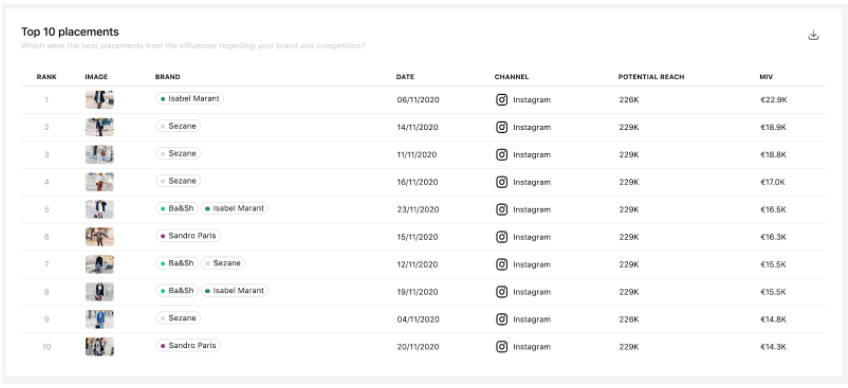
This table displays the top 10 placements in MIV (depending on the Voice type selected). For each placement there is the date of publication, the channel, potential reach and MIV.
Note: Some placements may mention several brands. For Online they would all get the same amount of MIV. For Print they may get different values depending on the page occupation.