
About Launchmetrics Spotlight
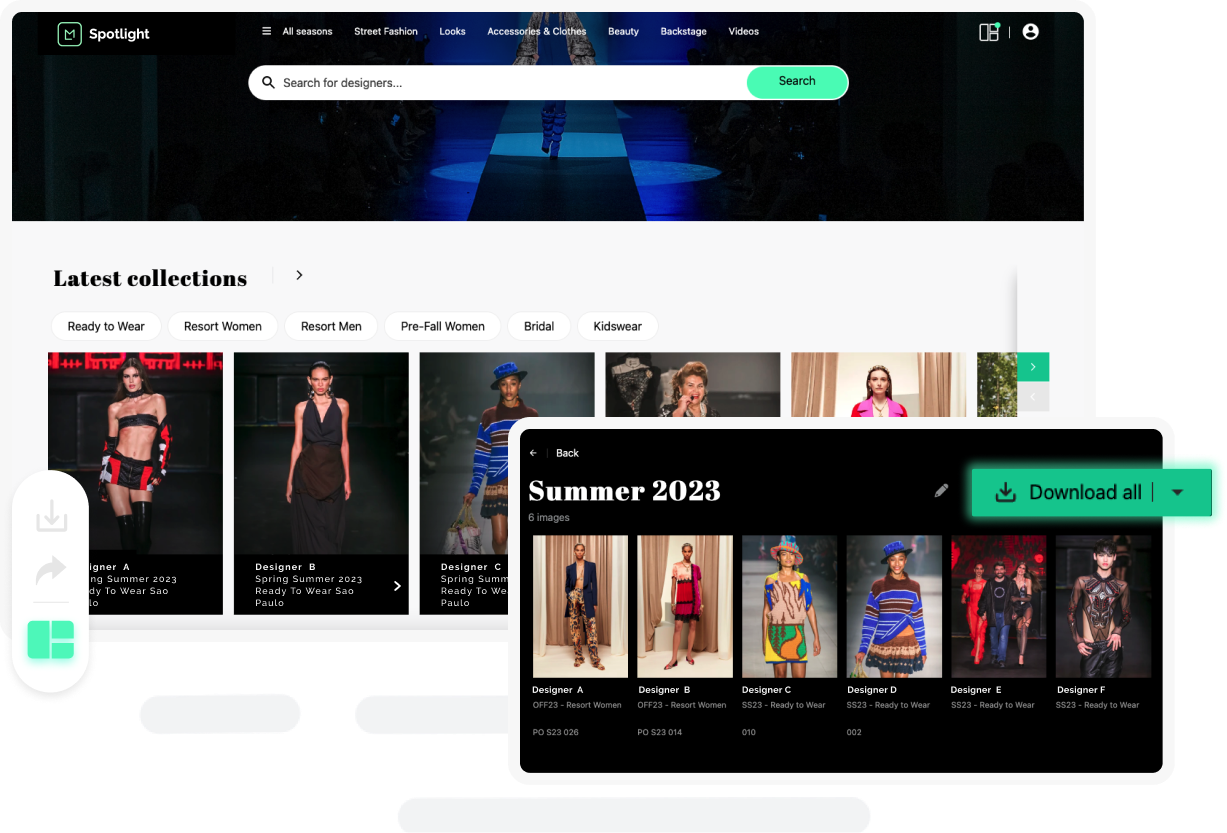
Launchmetrics Spotlight is a Centralized platform that connects Media and Content Creator and Brands through Visual Content, Events among many other things. It's daily used by more than 2000 editors across 500+ magazines including the most prestigious ones.
Read more at https://www.launchmetrics.com/spotlight
Access the feature
From header navigation
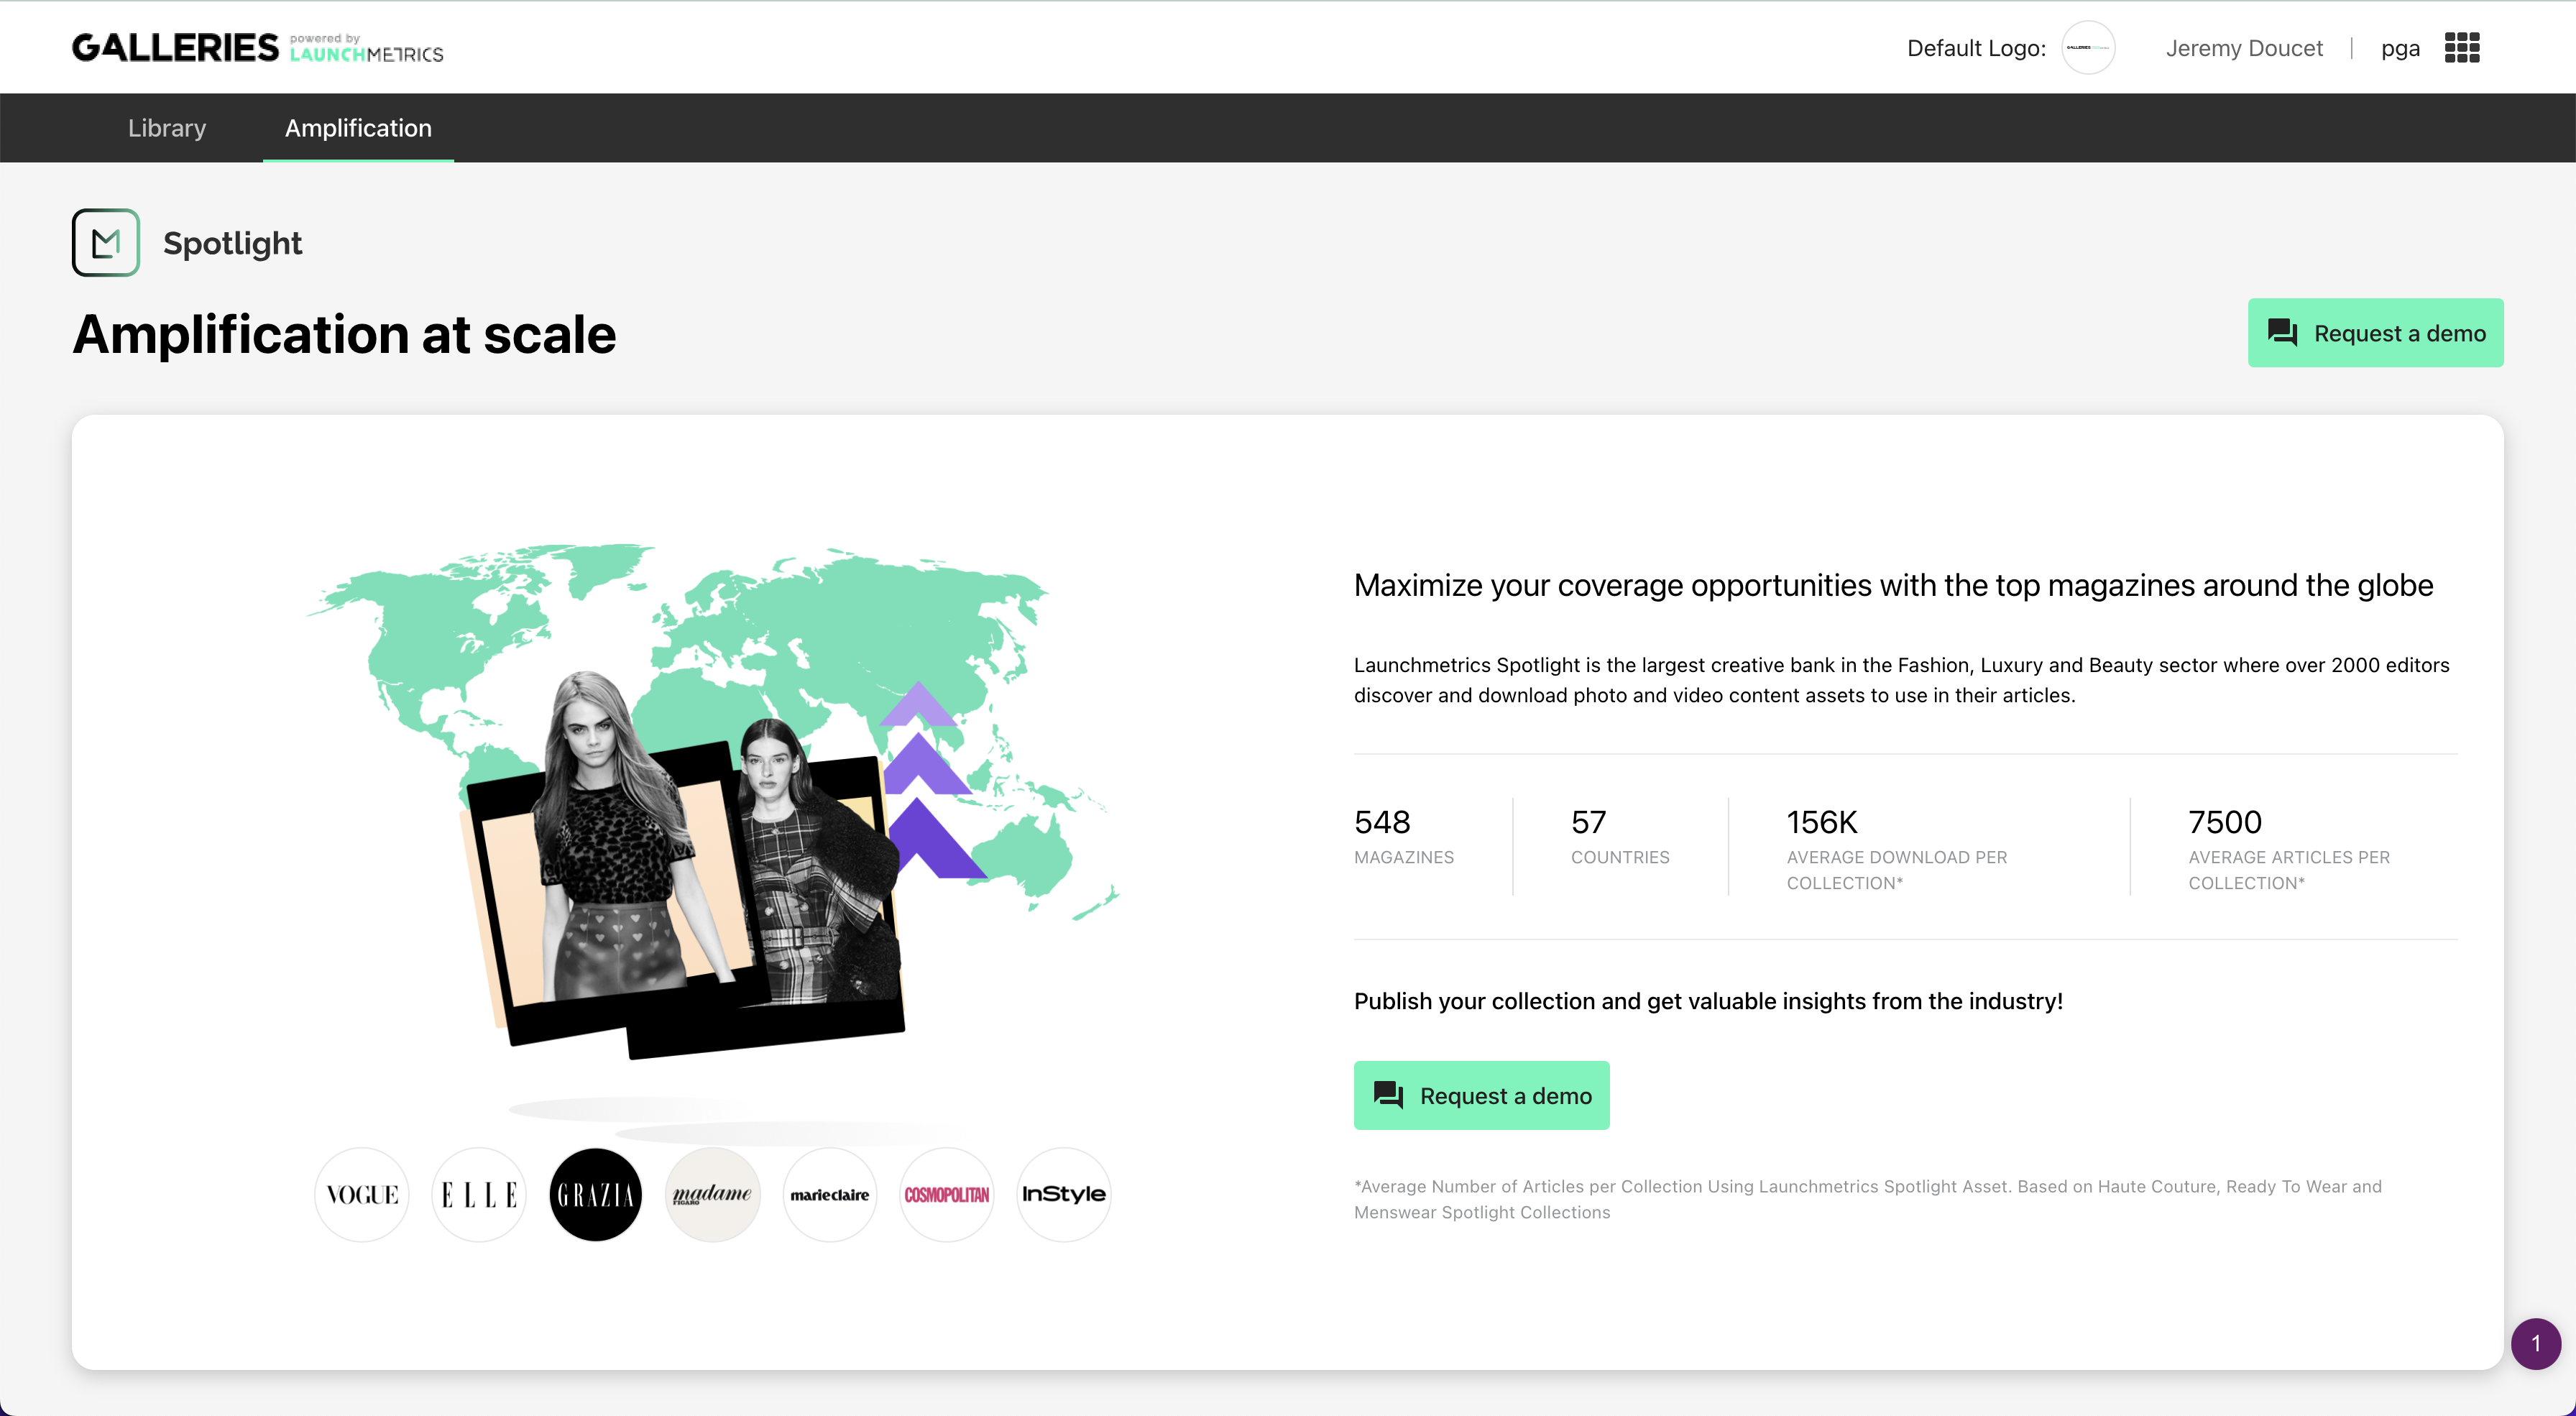
To access the feature, you need to follow these steps once you are in the Galleries application. Click on "Amplification" at the top and then select "Launchmetrics Spotlight." This will take you to the dedicated Spotlight page.
Direct URL
You can also access this page directly through a specific and unique URL for each collection. The list of collections and each collection have their own URL.
How to request the access
If the feature is not enabled, you can request its activation. To do so, simply click on the "Request a demo" button. This will send an email to the appropriate person who can activate and configure the feature for you. The activation process should be completed within one to two business days. Feel free to contact your dedicated account manager if you need to provide any additional information.
Eligibility criteria
Your account manager will guide you in case of any issues or queries.
Currently, the Spotlight feature is primarily accessible to fashion brands. As an agency, you may also be eligible for the feature, but you should discuss it with your account manager.
Manage content on Spotlight
Once the feature is activated, the first thing you will see is the list of collections published on Spotlight and the key data to measure their performance.
As mentioned before, we have already linked your Galleries application to the collections of your brands that have been published on Spotlight. This will allow you to view all of these collections and their performance.
By default, the collections are sorted to display the most recently published shows first.
Upload
First collection
If you have no collections published on Spotlight yet, you will need to upload your first collection. To do this, simply click on the "Upload First Collection" button and follow the instructions in the form.
New collection
At the top right of the collection page, you will find a button that allows you to upload a new collection.
Content moderation
Our team is responsible for uploading your images on Spotlight. We manually and automatically rename all the images to align them with our current naming conventions. This allows us to showcase your images prominently on the platform, making them easily accessible for editors to download. You have no control over the tags or the order of the images. If you would like to modify any information, please contact us to discuss it with our team.
Our team also ensures that the content you decide to publish is in line with the description you provide and adheres to the platform's guidelines. We accept all types of content related to presenting a collection in any form.
Delete content
Currently, you cannot choose to delete any published collections. The main reason is that our publishers need to be able to access and download previously published content at any time.
Navigation and Behavior of the Collection List
How to Read the Collection List
The collection presentation screen consists of a list of different collections published on Spotlight, along with associated data. At a glance, you should be able to quickly identify which collection it is and see the associated data.
The relevant data includes:
- Collection name: Brand + season + year + collection
- Publication date: This date can be entered by you at the time of publication or by our teams if present at your event.
- Views: The total number of views on this specific collection across all dates.
- Downloads: The total number of unique image downloads corresponding to this collection.
- Placements: The number of placements containing images from this collection.
- Online MIV: The sum of MIV (Media Impact Value) associated with articles containing images from your collection (see below, data disclaimer).
Sorting the Collections
You can sort the display of collections according to any criteria. Simply click on the title of any column to sort it in ascending or descending order, either chronologically or in reverse, according to your preference. By default, the display is ordered by the most recent publication.
Direct Access to Collection on Spotlight
From each collection in the list, you can click on a button that will take you directly to the Spotlight product. This direct link allows you to access the platform for free, with limited features, without the need to create an account. However, you still need to go through the product galleries to access Spotlight; otherwise, you will need to create an account.
After clicking on this link, you will be automatically redirected to the specific target collection.
Access to Data Dashboard
From each collection, you can click on the small data logo, which will allow you to access the data analysis page.
Each data analysis page corresponds only to the target collection. To switch connections, you need to go back to the list of collections and click on another one.
Collection Performance Dashboard
Data Introduction
Scope
- Users of Spotlight
The interface of Spotlight displays all the data related to users present on the platform. No data is hidden, regardless of its type, except for views and downloads by Launchmetrics platform administrators.
- Views
A view refers to an impression of one of your images from the targeted collection by one of our users, at a unique moment. If the same image is viewed multiple times by the same user, we count multiple views. Your images can be viewed from different places, whether it's on the Spotlight homepage or in the dedicated space for your collection.
- Downloads
This refers to the total number of image downloads from your collection. If a user downloads the same image multiple times, the count will reflect that.
Spotlight allows users to download images in different resolutions. Here, we only display downloads in high resolution. This means that we don't display all the downloads with watermarks or from all networks. The displayed downloads are more likely to lead to publications.
- Placements
This represents the number of articles where your images have been detected using Galleries technology. Currently, we only track web placements (no print or social) and only in the outlets that we monitor through Launchmetrics tools.
- MIV €
This refers to the sum (in euros) of placements (mentioned above) where your images have been detected.
Disclaimer about the placement images tracking algorithm
- Scope
We track all and only the images downloaded on Spotlight. If an image is not downloaded there, it should not be used in an article, and therefore, we do not search for it in fashion articles.
- Analysis timing
We perform image matching once a week, specifically on Monday mornings. Downloaded images will be included in the analysis only if they were first downloaded less than 28 days ago. This means that we will search for these images three times consecutively after their initial download. This is because the overwhelming majority of publications occur shortly after the show and the collection upload.
Global Navigation
💡 In this section, you will learn how to navigate the data dashboard and read the reports it contains.
Filters
Once these filters are applied, they have an effect on all sections of the Data Dashboard.
Date
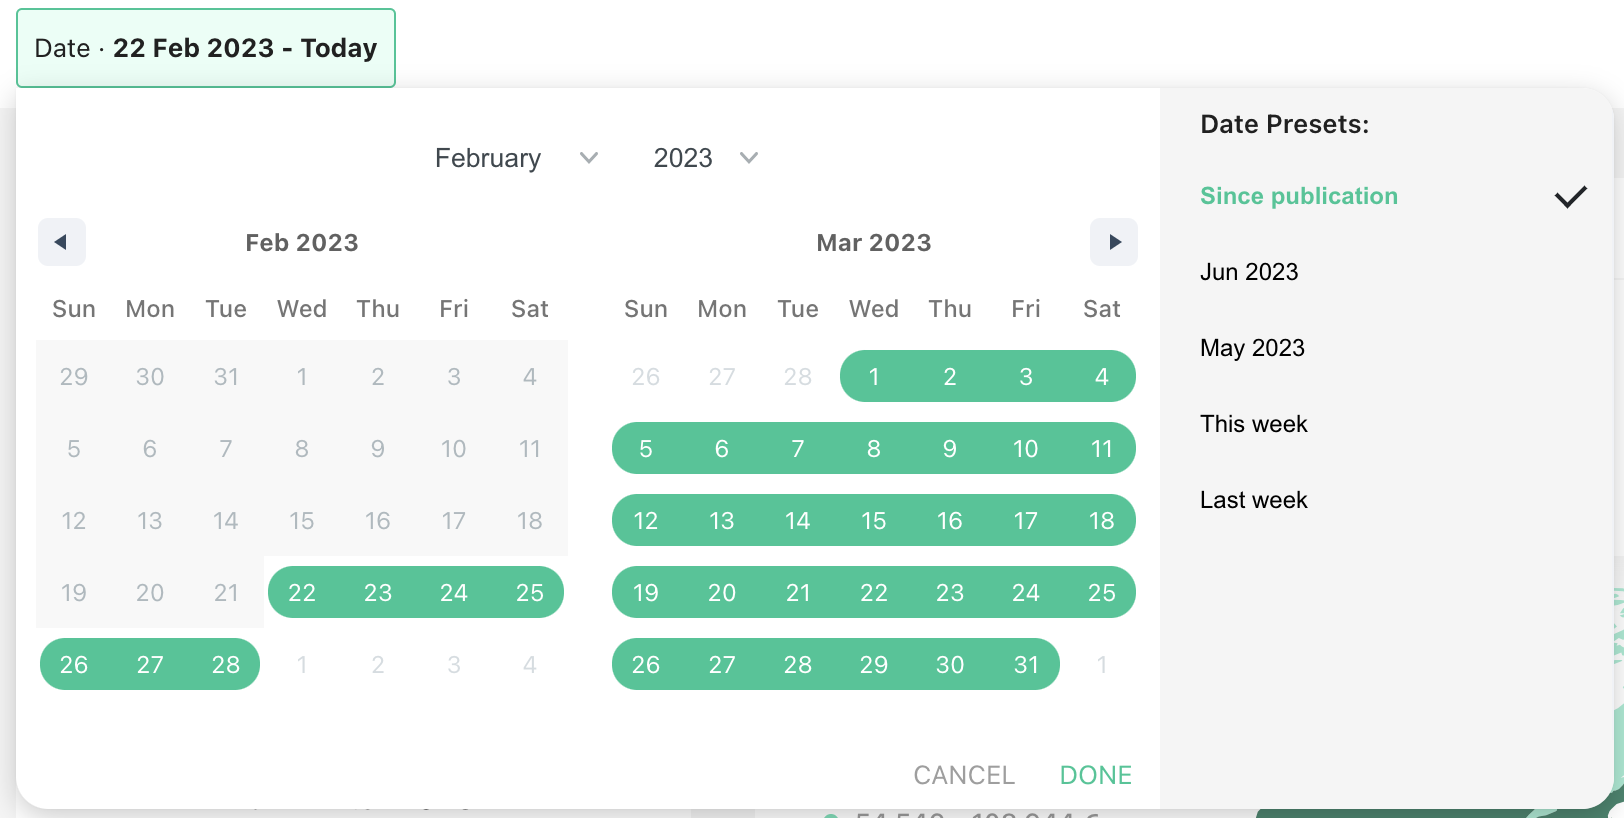
You can use the date filter located at the top left of your Dashboard at any time. You can select any start and end date, keeping in mind that any date prior to the collection's publication date will not be considered. This filter will be applied to all tabs of the Dashboard until you modify it.
We have provided preselected filters for this week, this month, or previous months.
Collection Thumbnail
 T
T
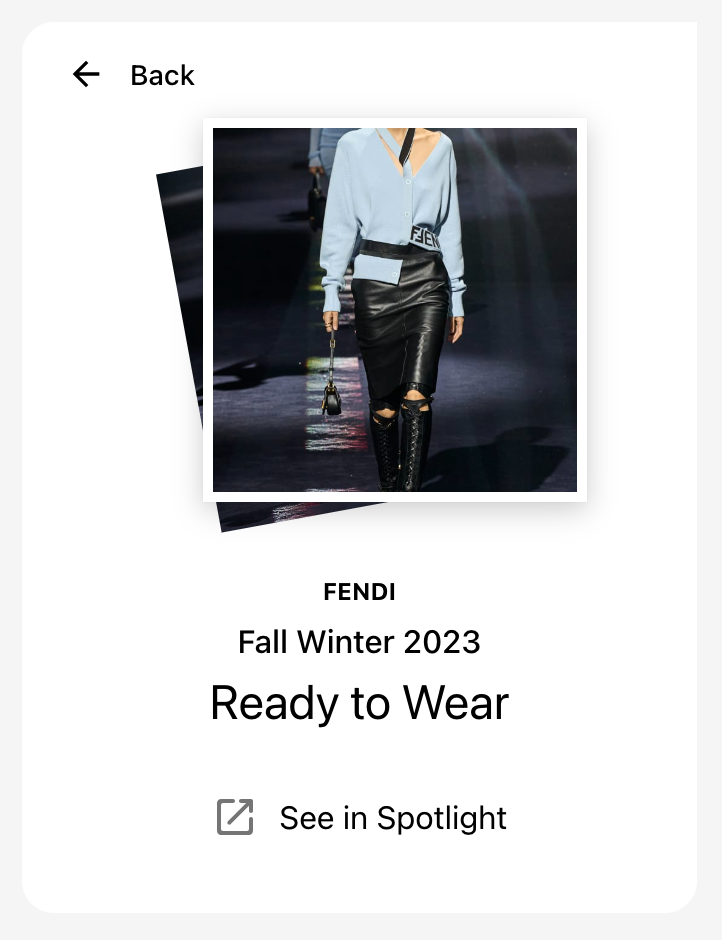
This block is always available on the left side of the screen, regardless of the language you are using. It represents an image from your collection (typically the first one according to our selection) and provides a link that allows you to directly access the collection in Spotlight with a single click.
Summary Tab
This tab summarizes the overall performance of your collection through various graphs. You can find detailed information for each graph in the following tabs on the same page.

Global Metrics
- Online MIV: Sum of MIV for all placements.
- Placements: Number of distinct URLs where placements have been detected.
- Views: Total number of views for your images. If 10 images have been viewed 10 times each, this number will be 100.
- Downloads: Total number of downloads for your images, regardless of resolution (excluding watermarked downloads).
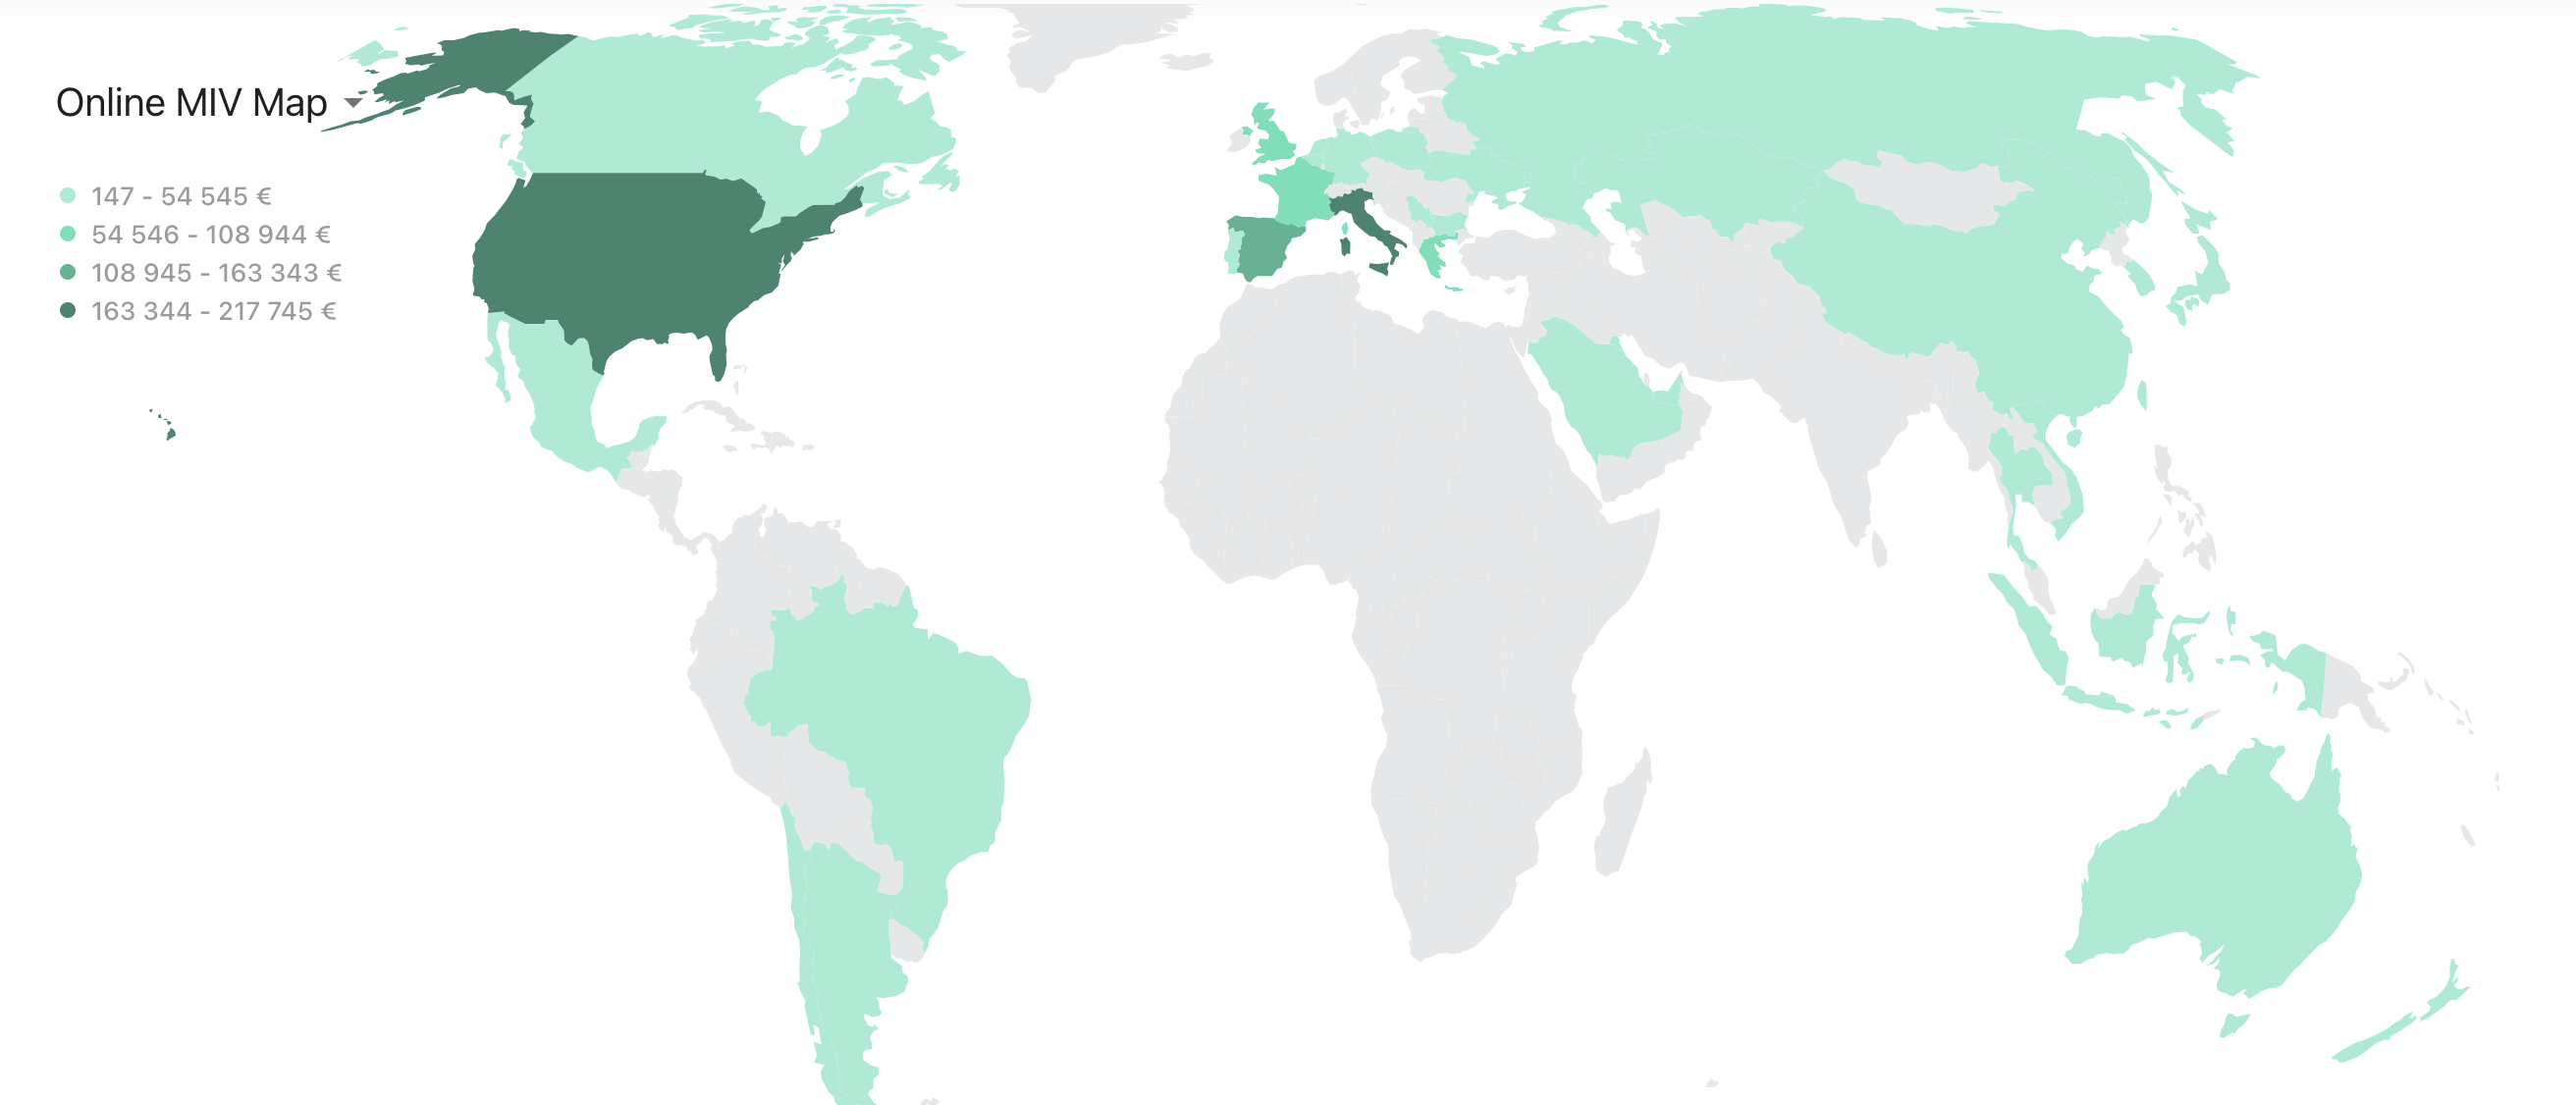
Online MIV Map
This is a graphical representation of your collection's performance by location. Each country is assigned a color corresponding to its performance in terms of views, downloads, or articles. You can use the dropdown menu on the left to select the metric by which you want to compare countries.
The colour scale is dynamic and depends on the total number of downloads and articles for your collection. From one collection to another, this scale will vary to provide a world map with maximum contrast.
On hover, you can see specific data for an individual country, such as MIV, articles, downloads, or views.
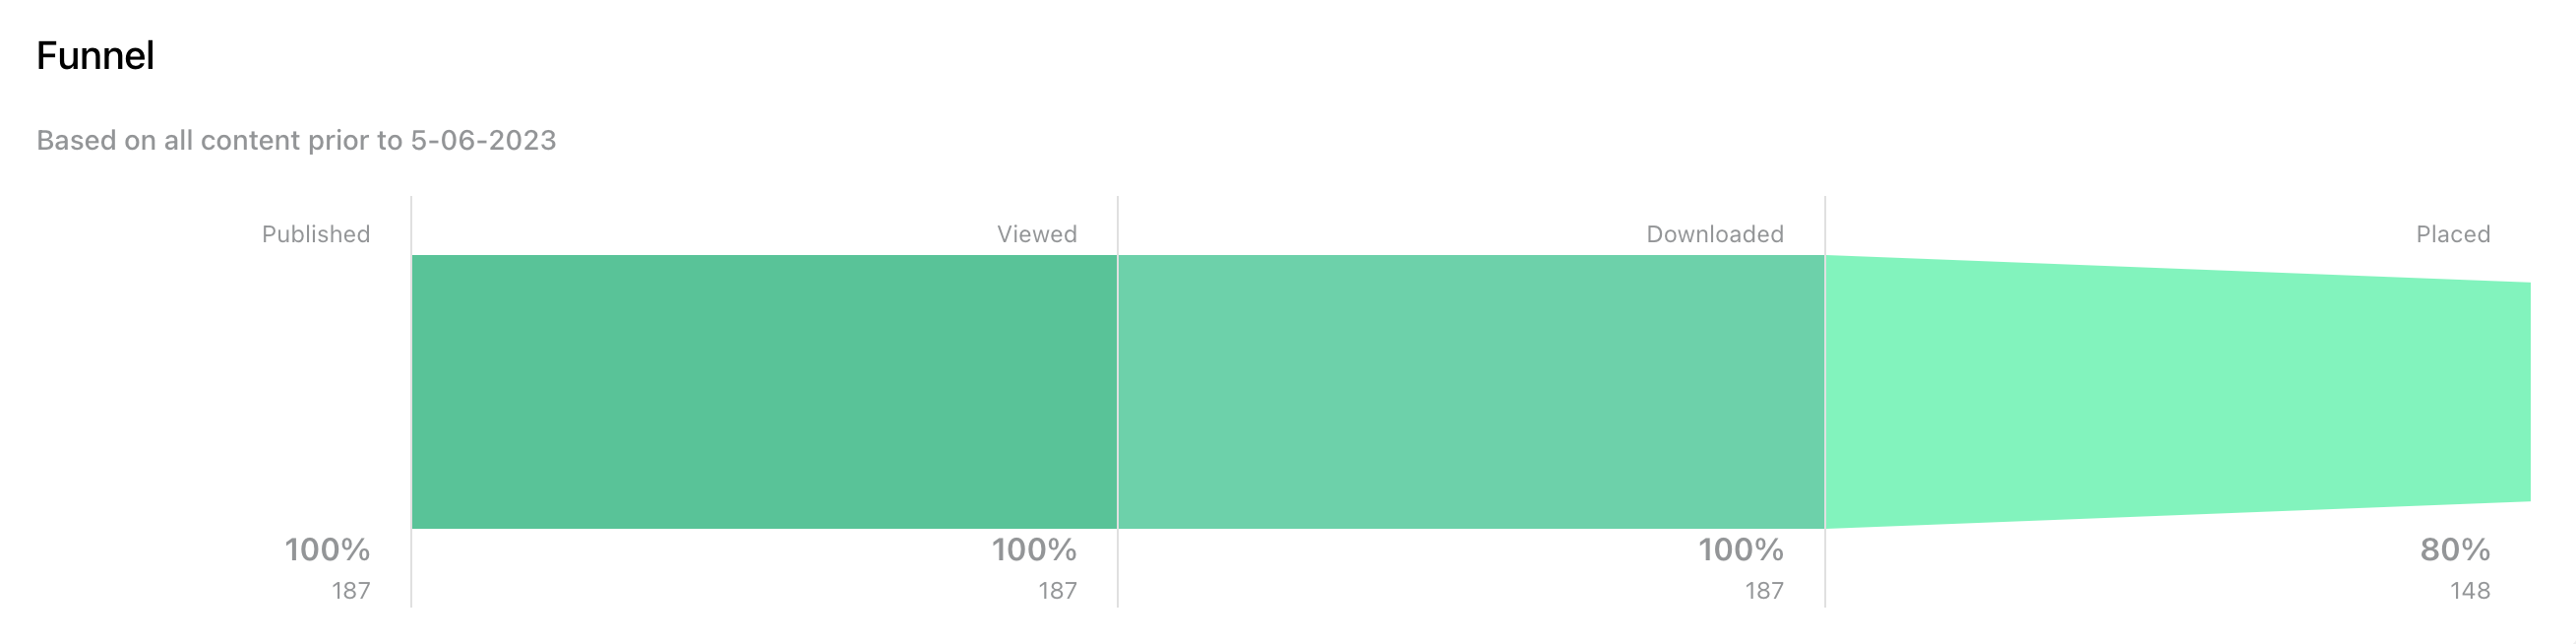
Funnel
This graph represents the performance of your collection through a performance funnel. The funnel allows you to quickly visualize the conversion rate of an image from its publication on Spotlight to its publication in a web article. The different stages of the funnel include publication, views, downloads, and usage in an article.
For each stage, we display the conversion rate relative to the total number of uploaded images.
Note that the date filters only apply to the end date, and we always consider all images uploaded to the platform.
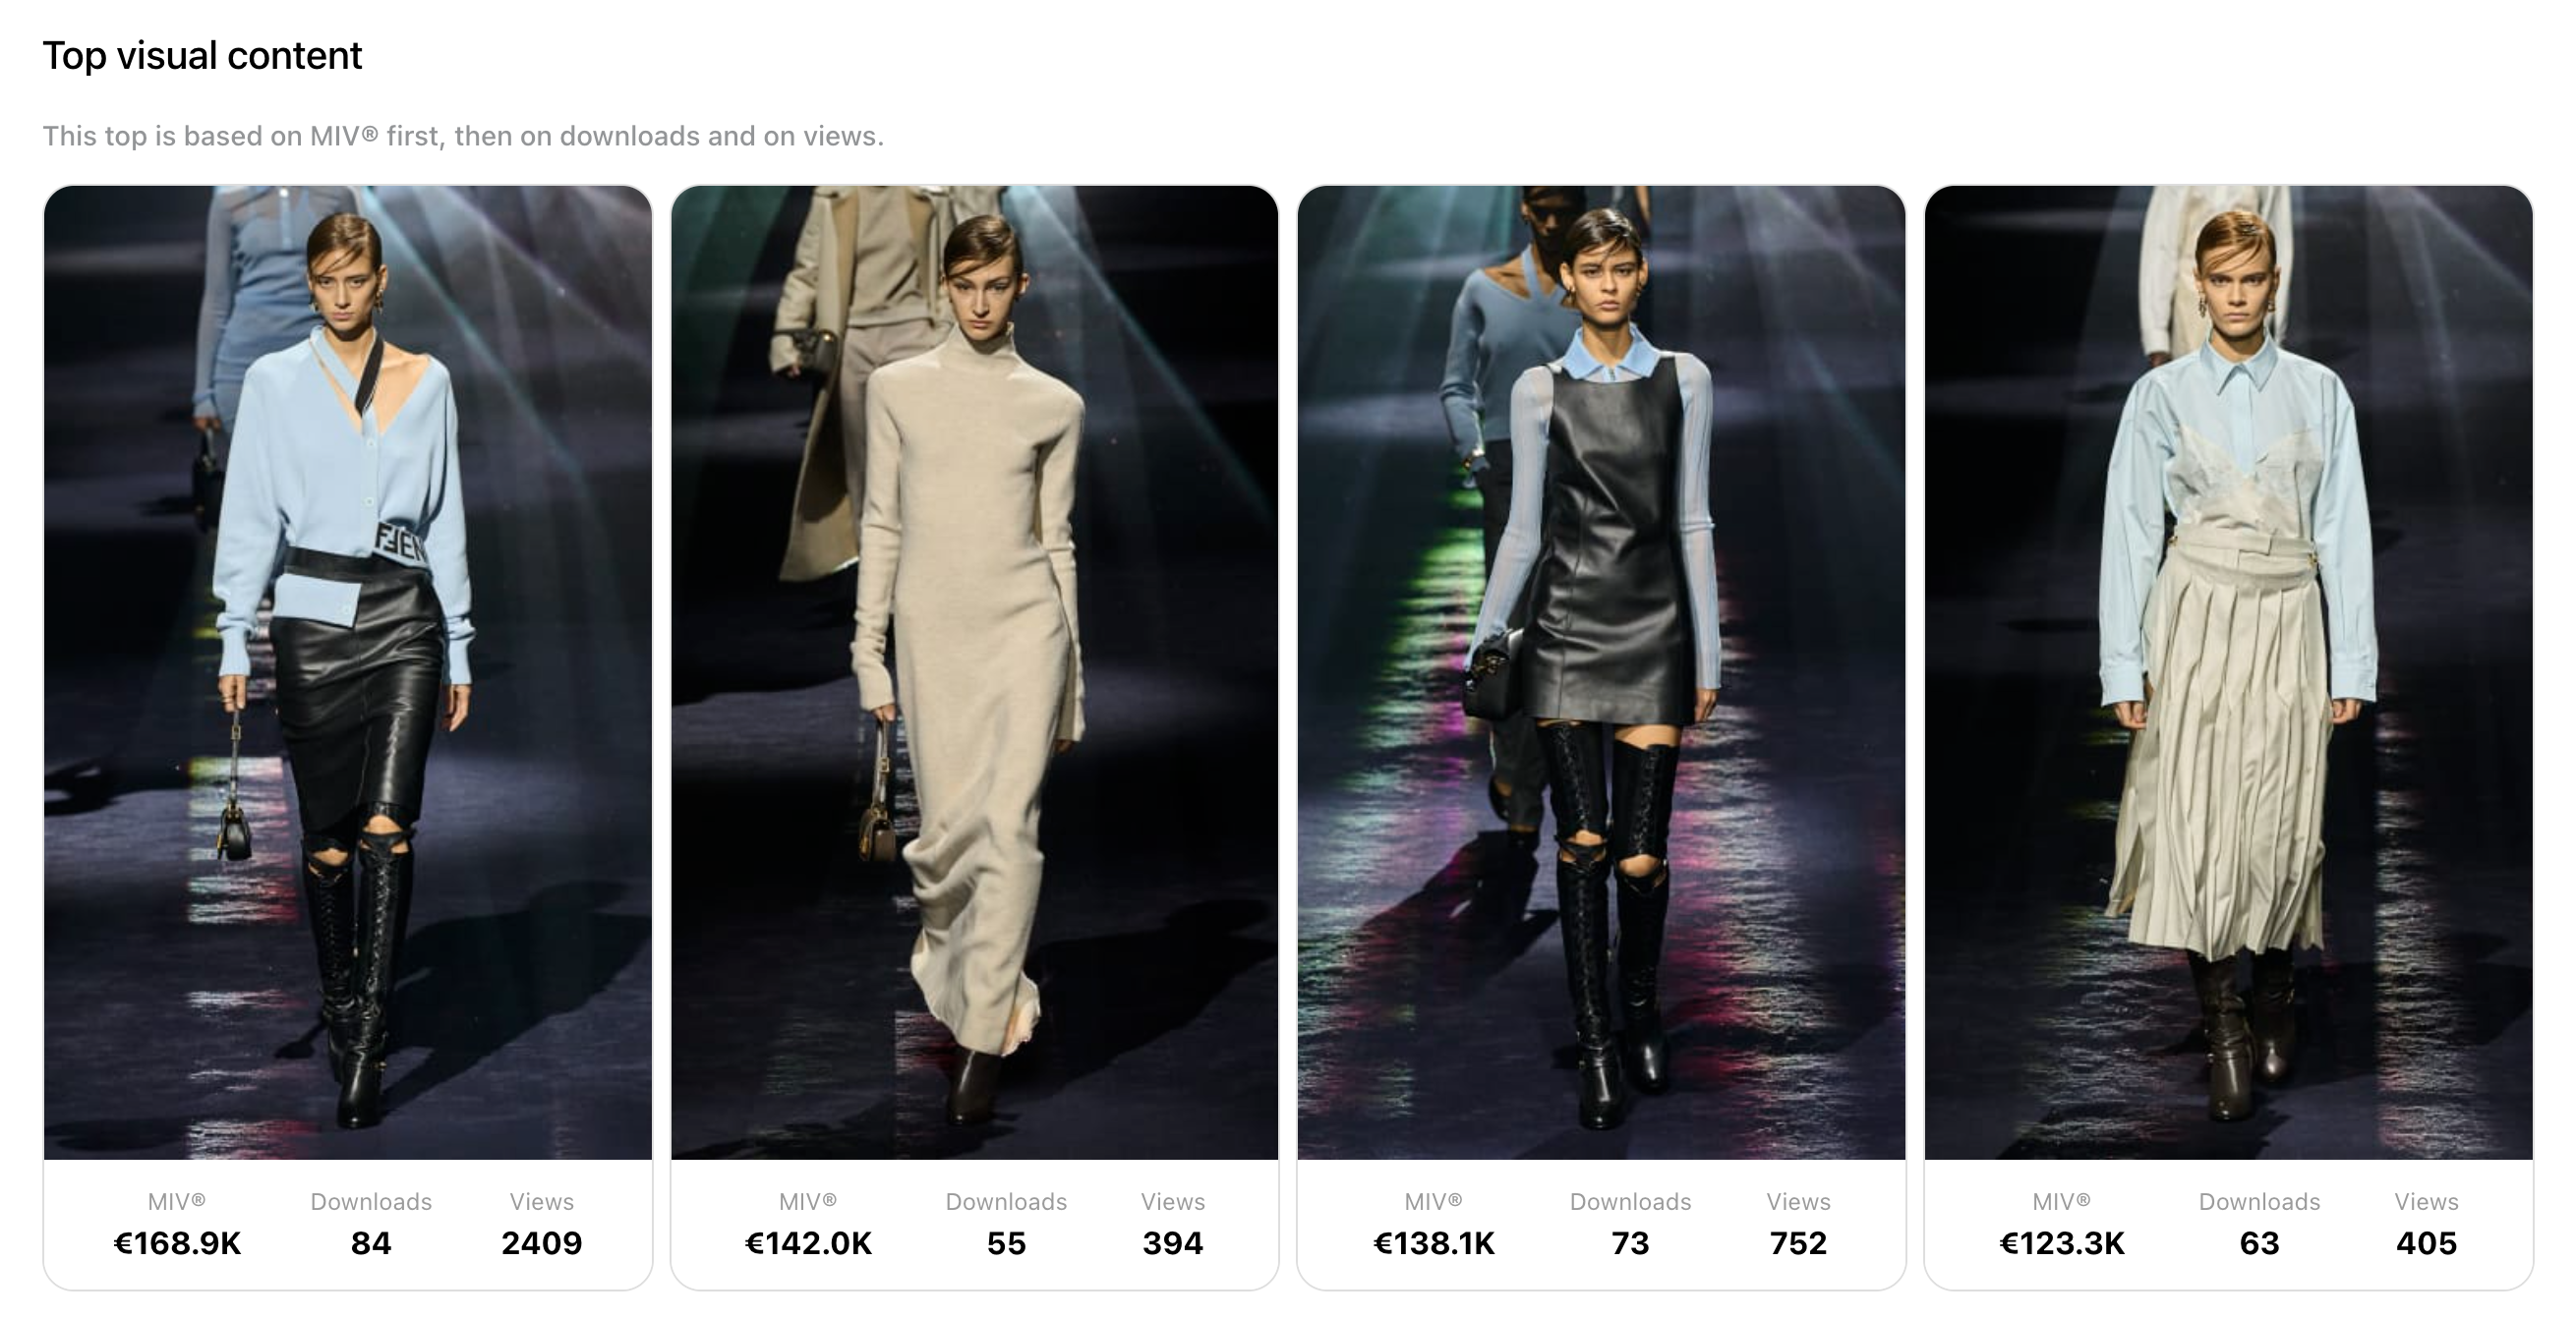
Top Visual Content
This report highlights the top-performing images from your collection. We rank the images based on the total MIV of each image and display the most performing ones.
If no articles have been detected, we compare the images based on the number of downloads. If no images have been downloaded either, we compare based on the number of views.
Below each image, we display the total MIV, downloads, and views for each of them.
We only display the top four performing images here.
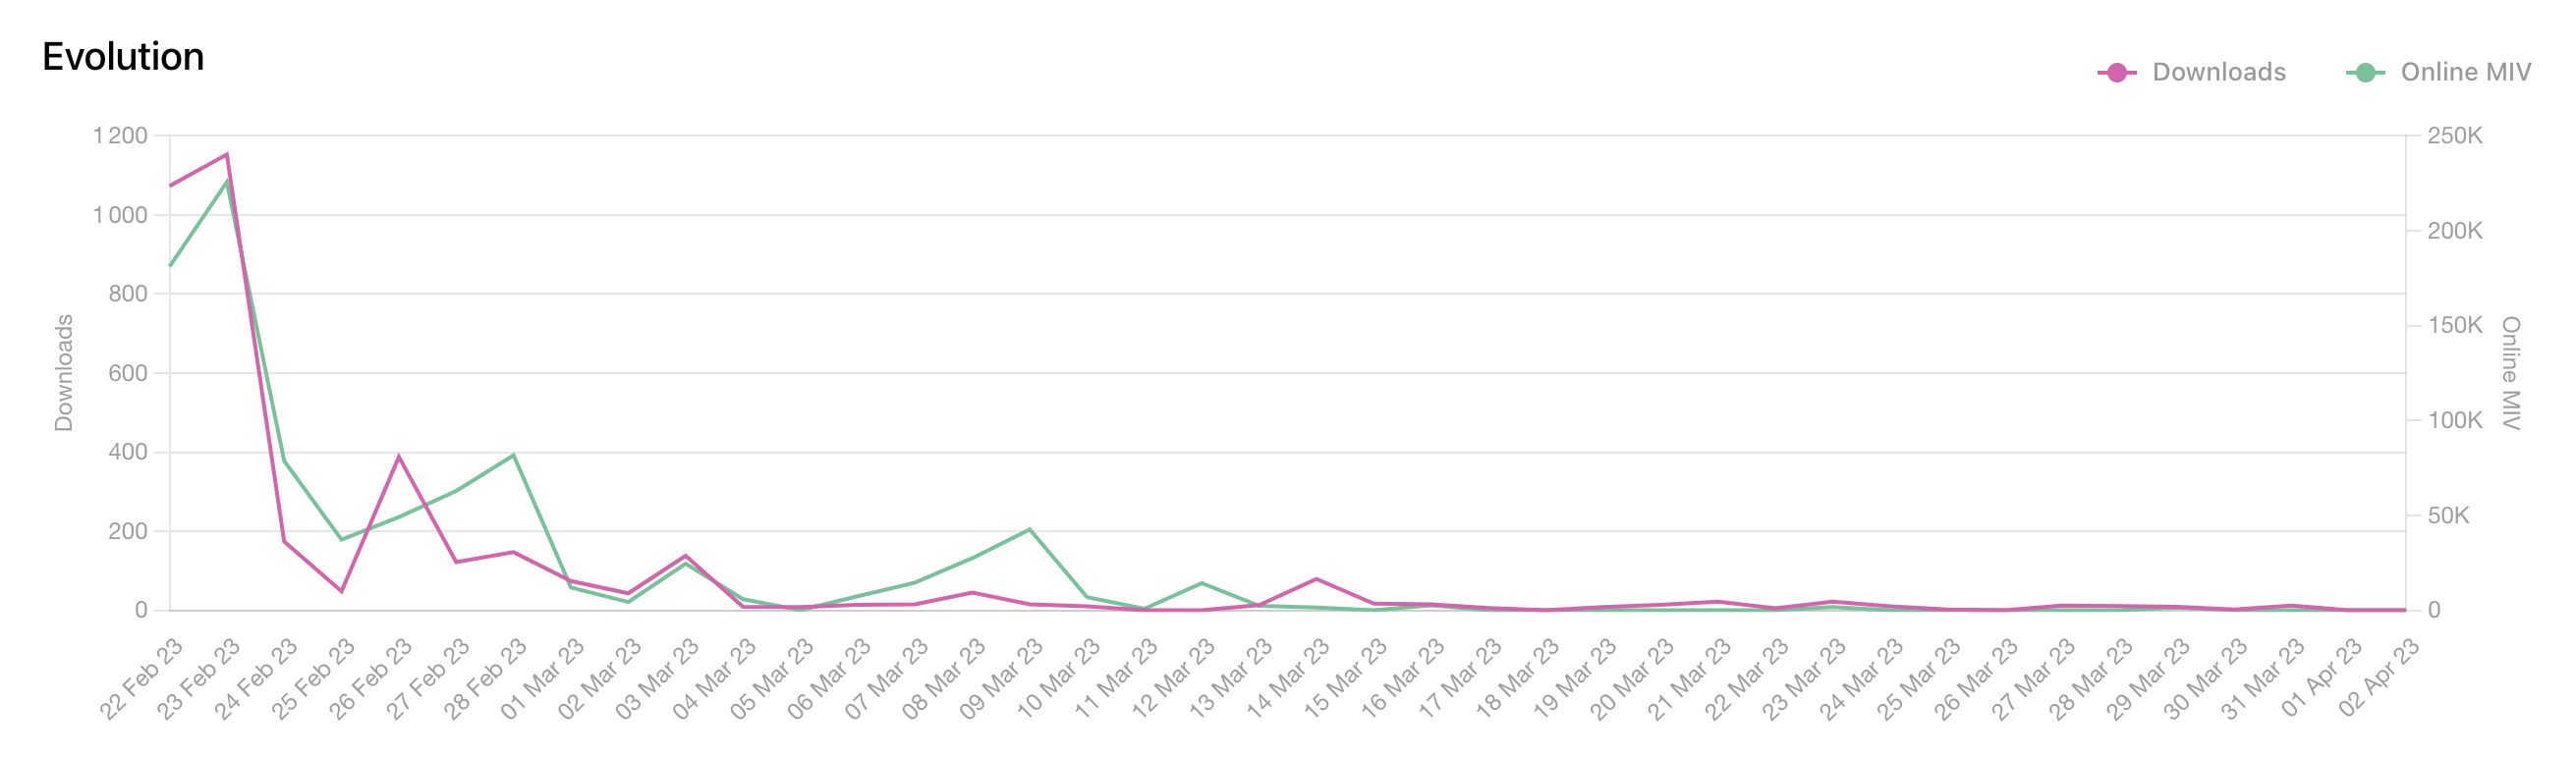
Evolution
This graph represents the performance of your collection over time. It is directly affected by the date filter and allows you to measure the number of downloads and the associated MIV for the collection within the selected time range.
It is worth noting that the collection's performance is generally linked to its upload date.
Visitors Tab
Global navigation
This tab allows you to monitor the actions and interests of Spotlight users with your content, either at an individual level for editors and journalists or on a larger scale for magazines, also known as Voices.
At the top right corner, you have a button that allows you to switch between viewing the list of individual users and the list of magazines. By default, the order is sorted based on common interactions, with users and magazines that have engaged the most with your content appearing at the top.
- For each editor, you can see their first name, last name, email, position, and magazine affiliation, as well as the number of image views and image downloads.
- For each magazine, you can see its name, country, the number of editors belonging to that magazine who have interacted with your content, and the total number of views and image downloads from each of them.
There is pagination at the bottom of this page, allowing you to access the entire list of users or magazines.
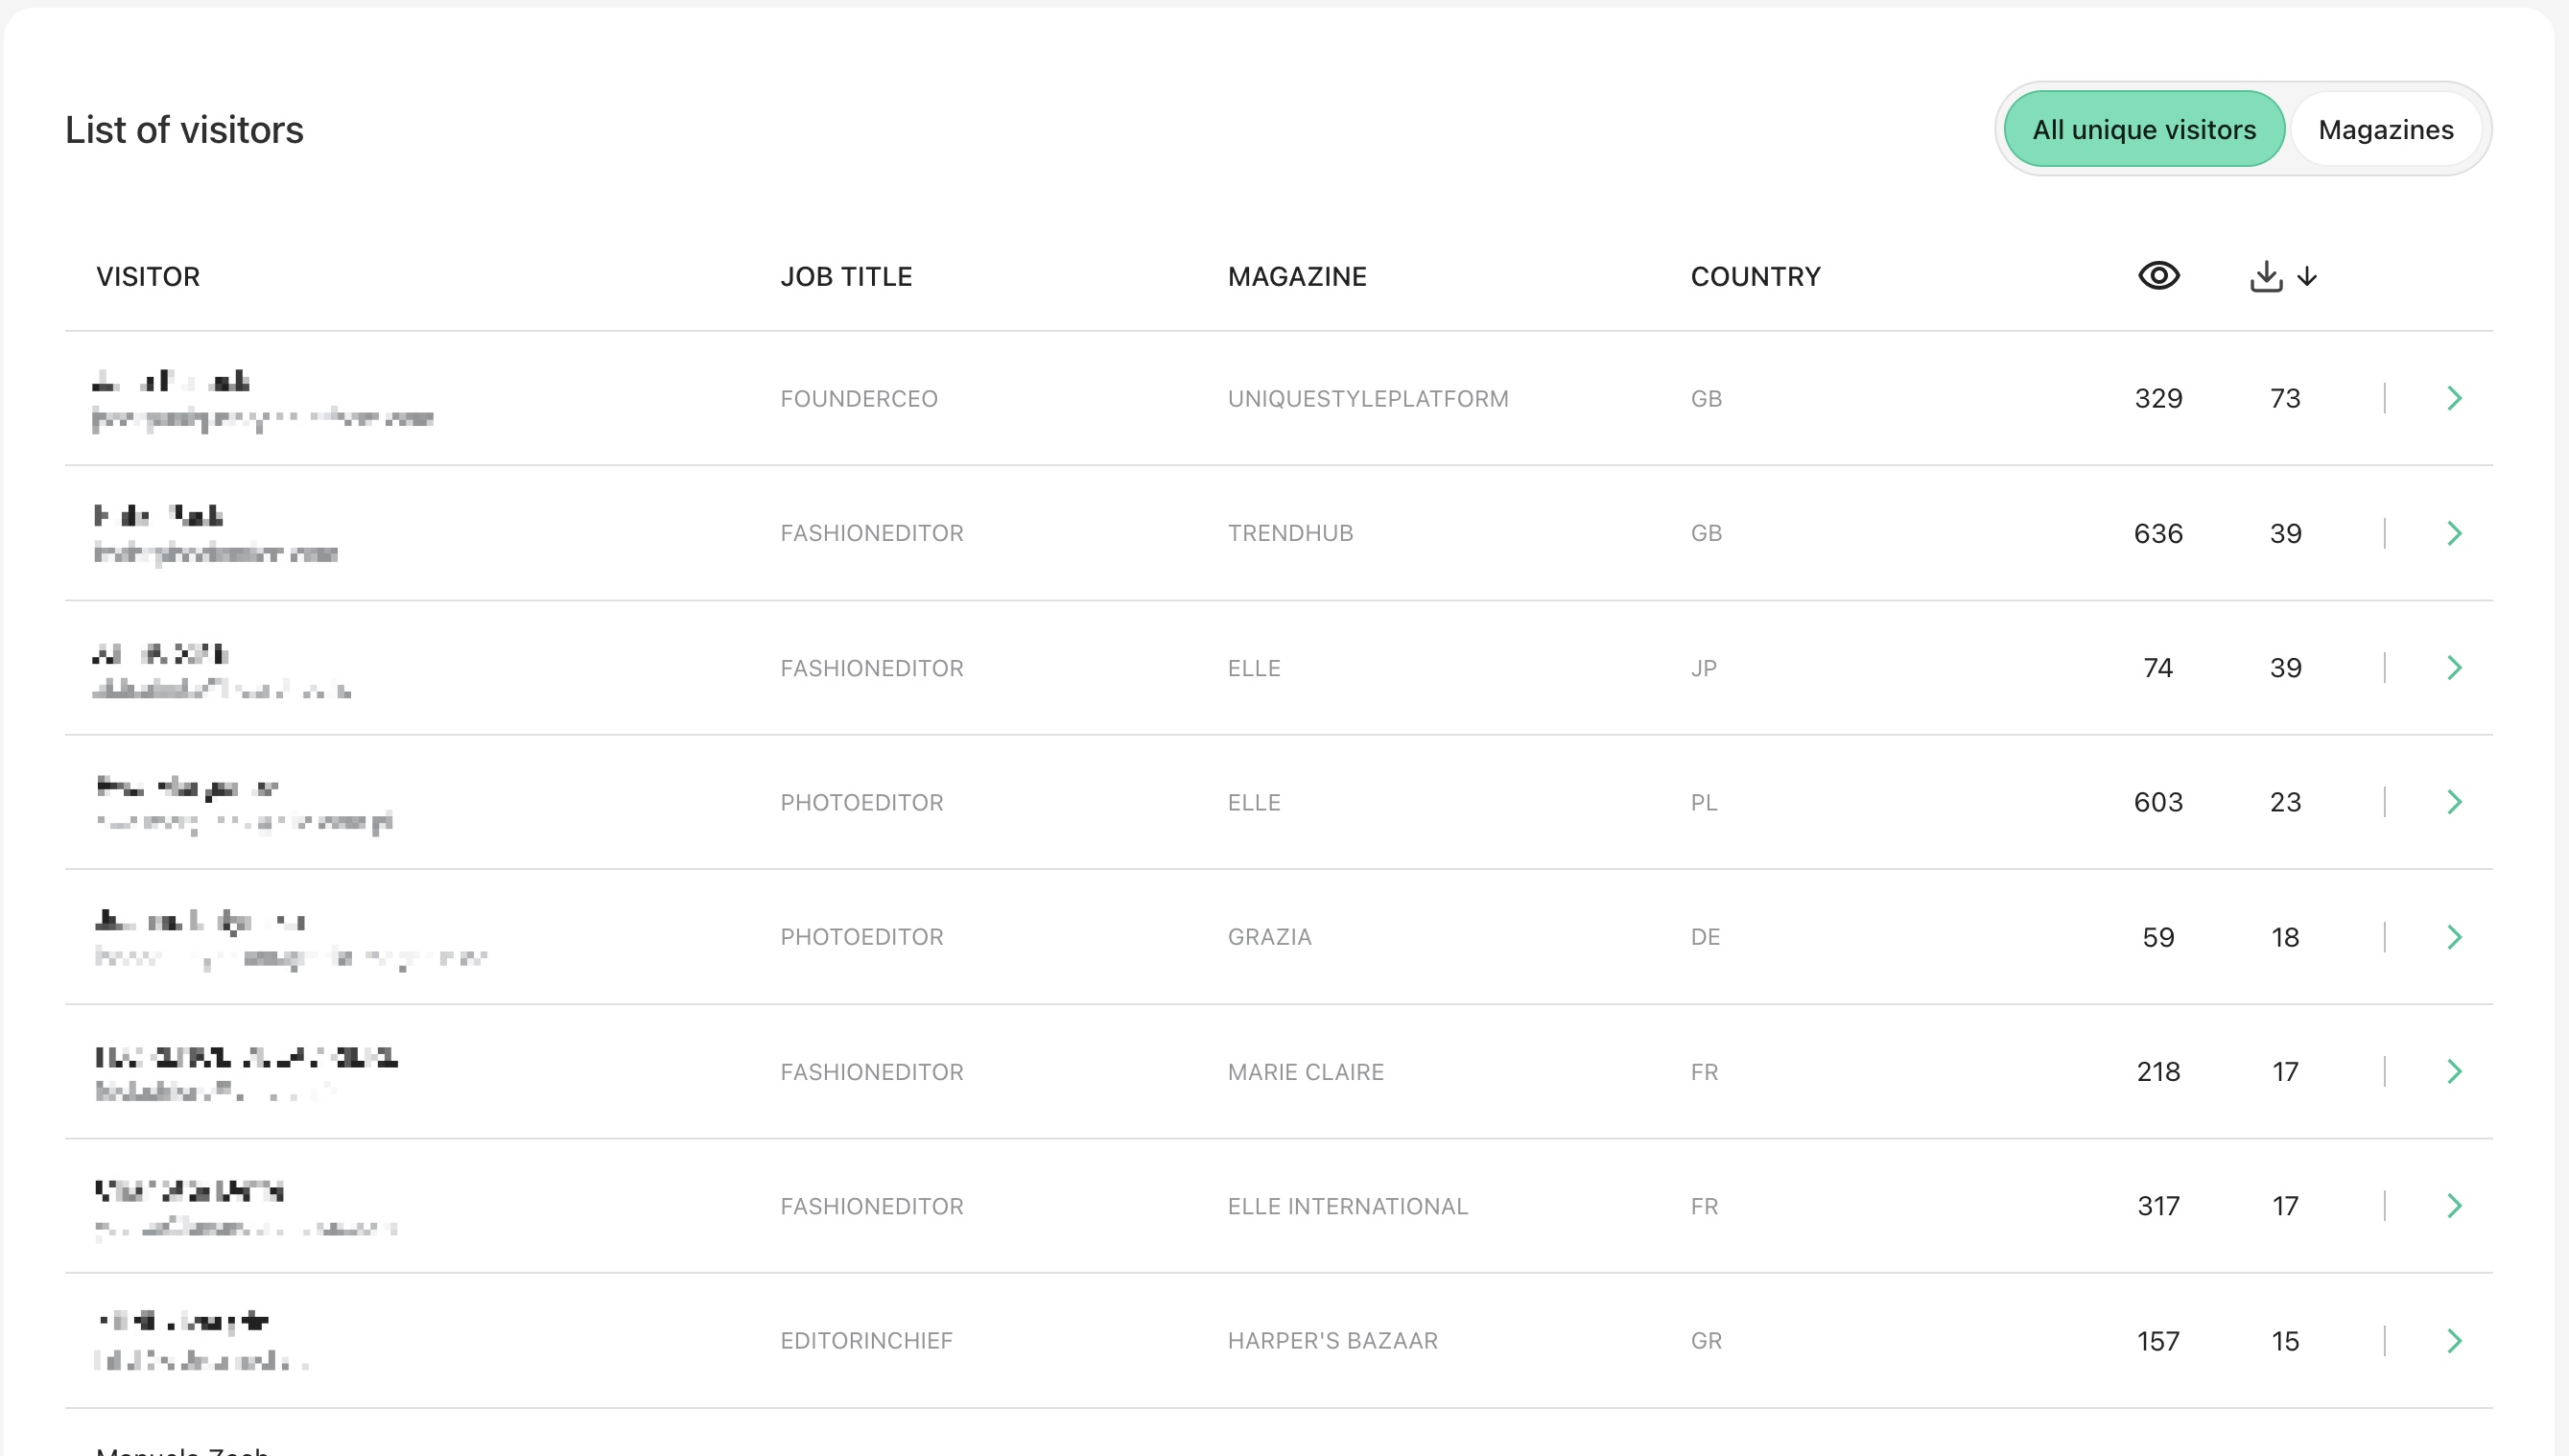 List of unique visitors from Spotlight in Galleries
Voice Panel
When clicking on a specific user or a magazine, you will open a panel called the "Voice Panel". That panel aims to describe all related interactions from that Voices (user or magazine) with your content on Spotlight.
All data described below are impacted by the date filter on top of your dashboard.
At the editor level, this Panel will display:
- Information of the user
- Name and surname
- Job Title
- Magazine they're working in
- Activation
- Total number of downloads
- The overall number of views
- Performance Funnel of your collection: from % of images viewed to % of images downloaded
- Top Visual content
- List of preferred content ranked by downloads then views then name
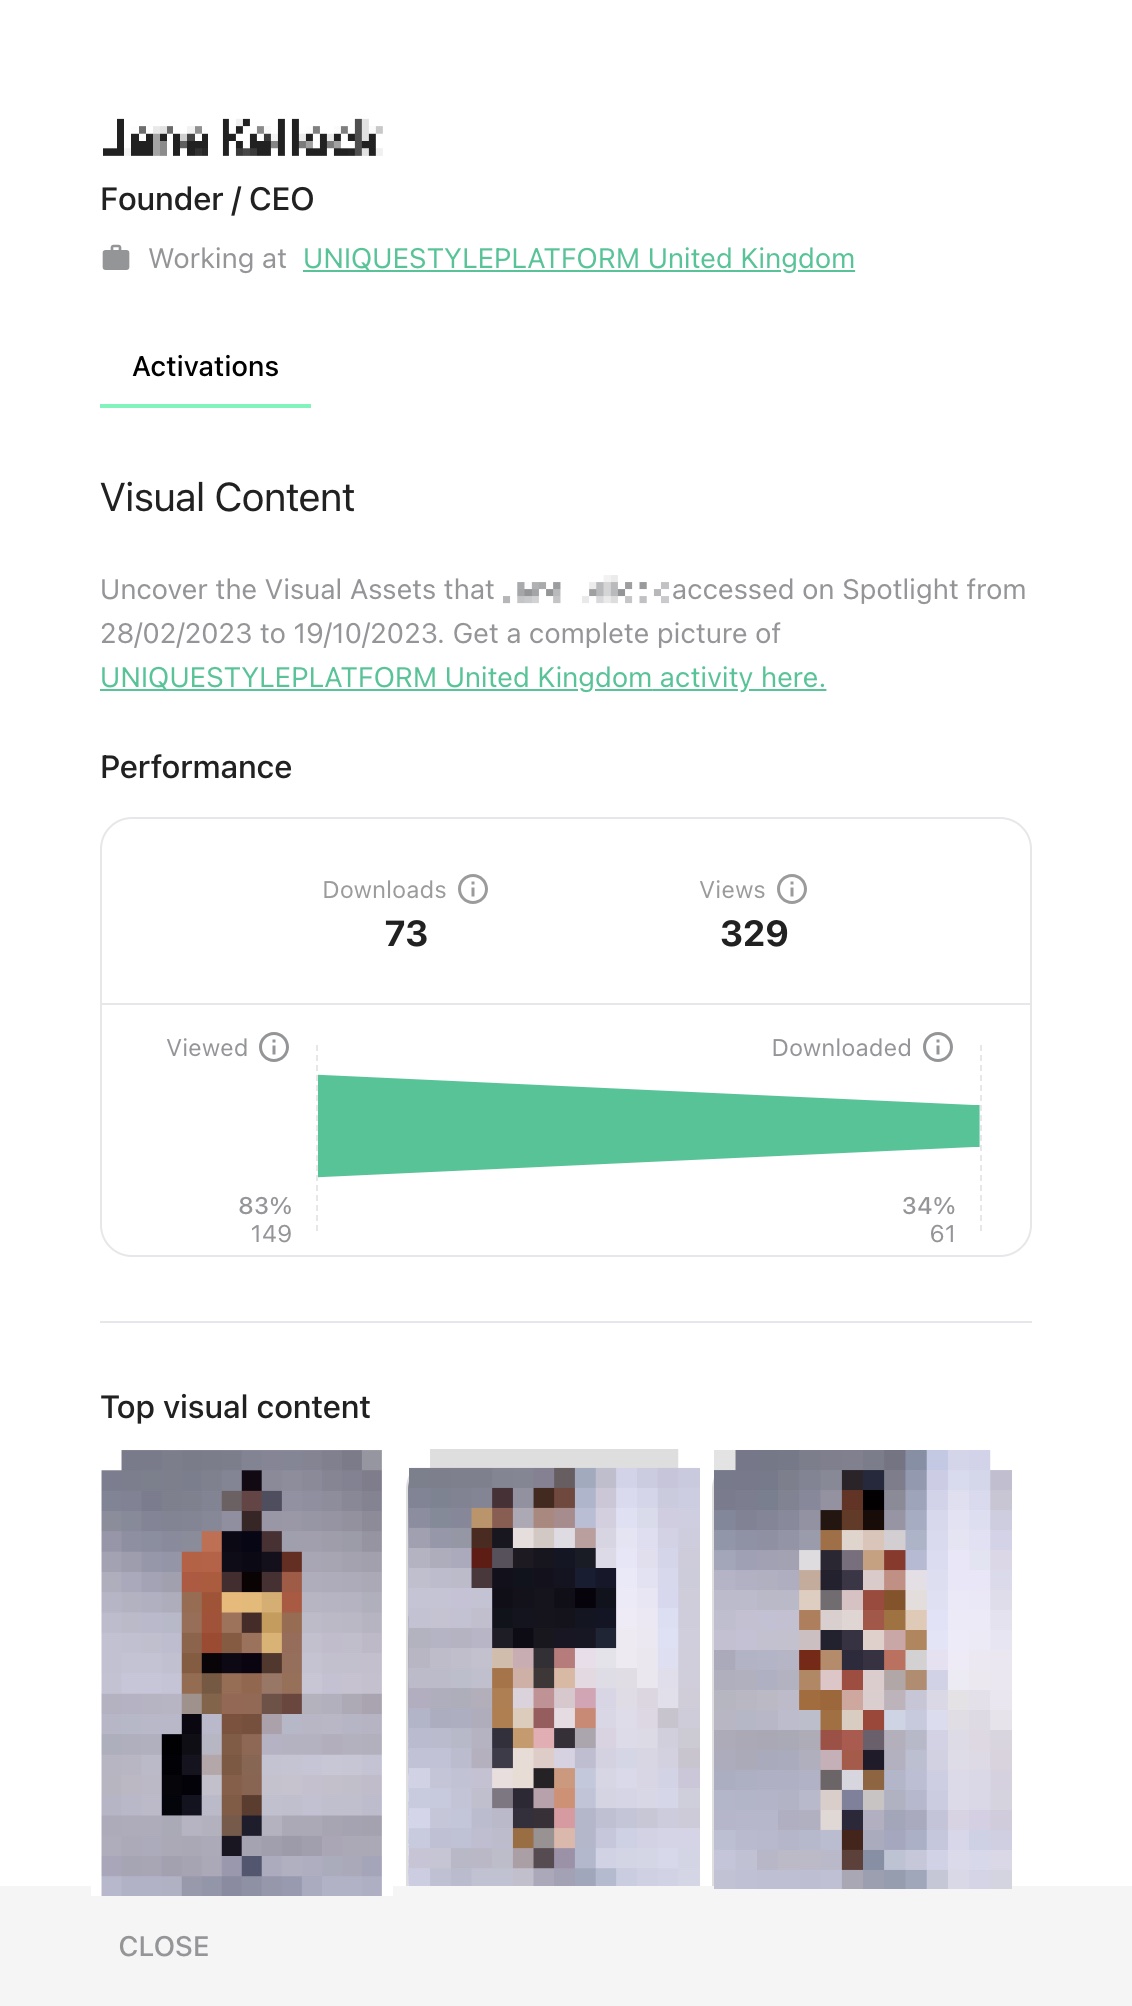 Voice Panel (Editor)
At the Magazine level, this Panel will display:
- Information about the Magazine
- Name and type
- Activation
- Total number of downloads
- The overall number of views
- Number of placements
- The sum of generated MIV with these assets
- Performance Funnel of your collection: from % of images viewed to % of images placed
- Top Visual content
- List of preferred content ranked by MIV then downloads then views then name
- Top Placement
- List of most performing placement from those voices using these images
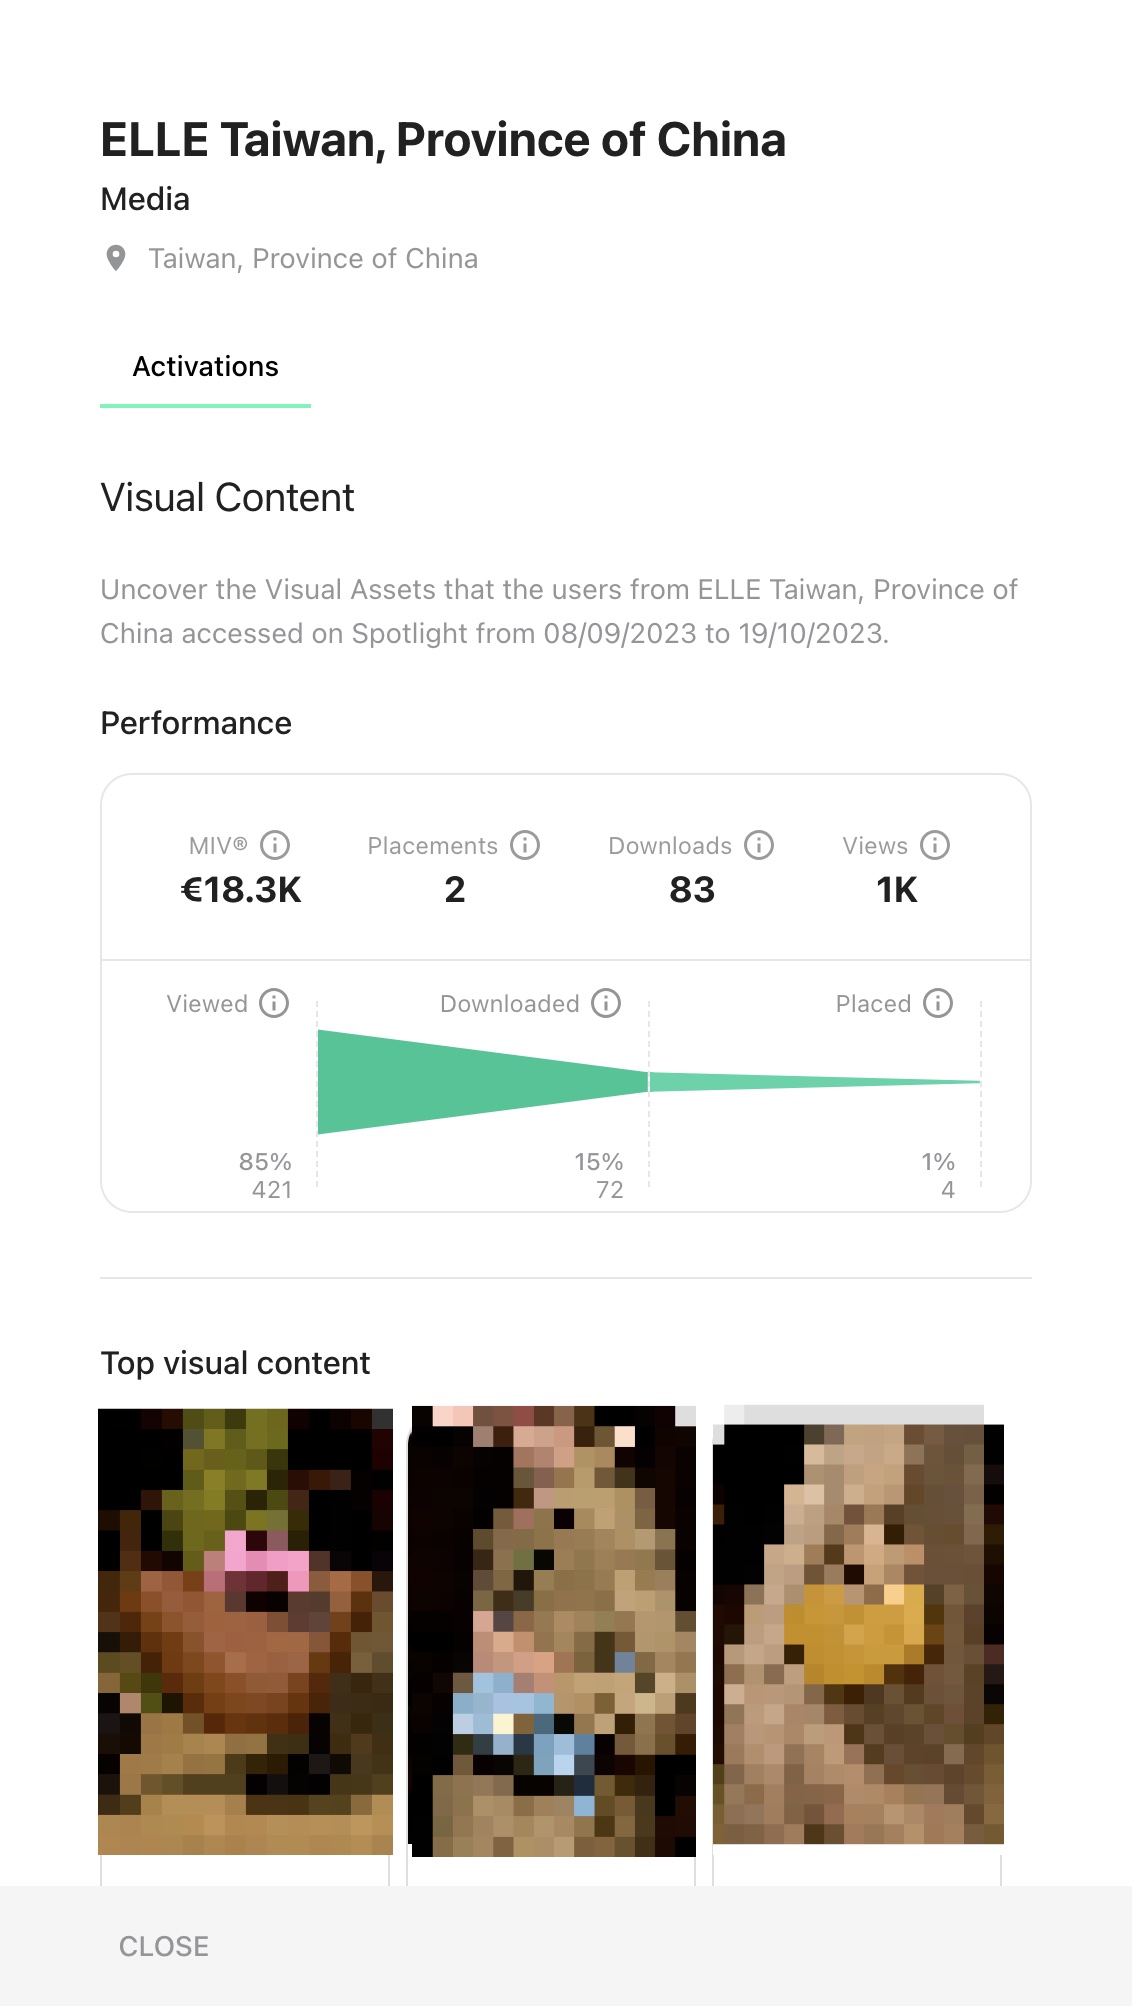 Voice Panel (Magazine)
Content Tab
This tab or page allows you to measure the performance of your collection's images. All the collection's images are displayed here as thumbnails, with key performance data shown below each one. By default, the images are sorted in descending order based on Media Impact Value (MIV). In case your images have not been used in articles and, therefore, do not have MIV values, they will be sorted by the number of downloads in ascending order. Each image displays the total MIV sum from different articles in which it has been detected, along with the total number of downloads and views. You can change the display order of the images by clicking on the button provided.
By clicking on an image, you can access specific details about that image. Below each image, after clicking on it, you will see the main data related to it, including its total MIV, the number of articles, the number of downloads, the number of views, and a detailed list of each article with its individual MIV and reach. You can click on each article to open them in another tab.
Please note that we only detect articles within the three weeks following the first download of each image. Therefore, an article may not be mentioned here if it was published after that timeframe.
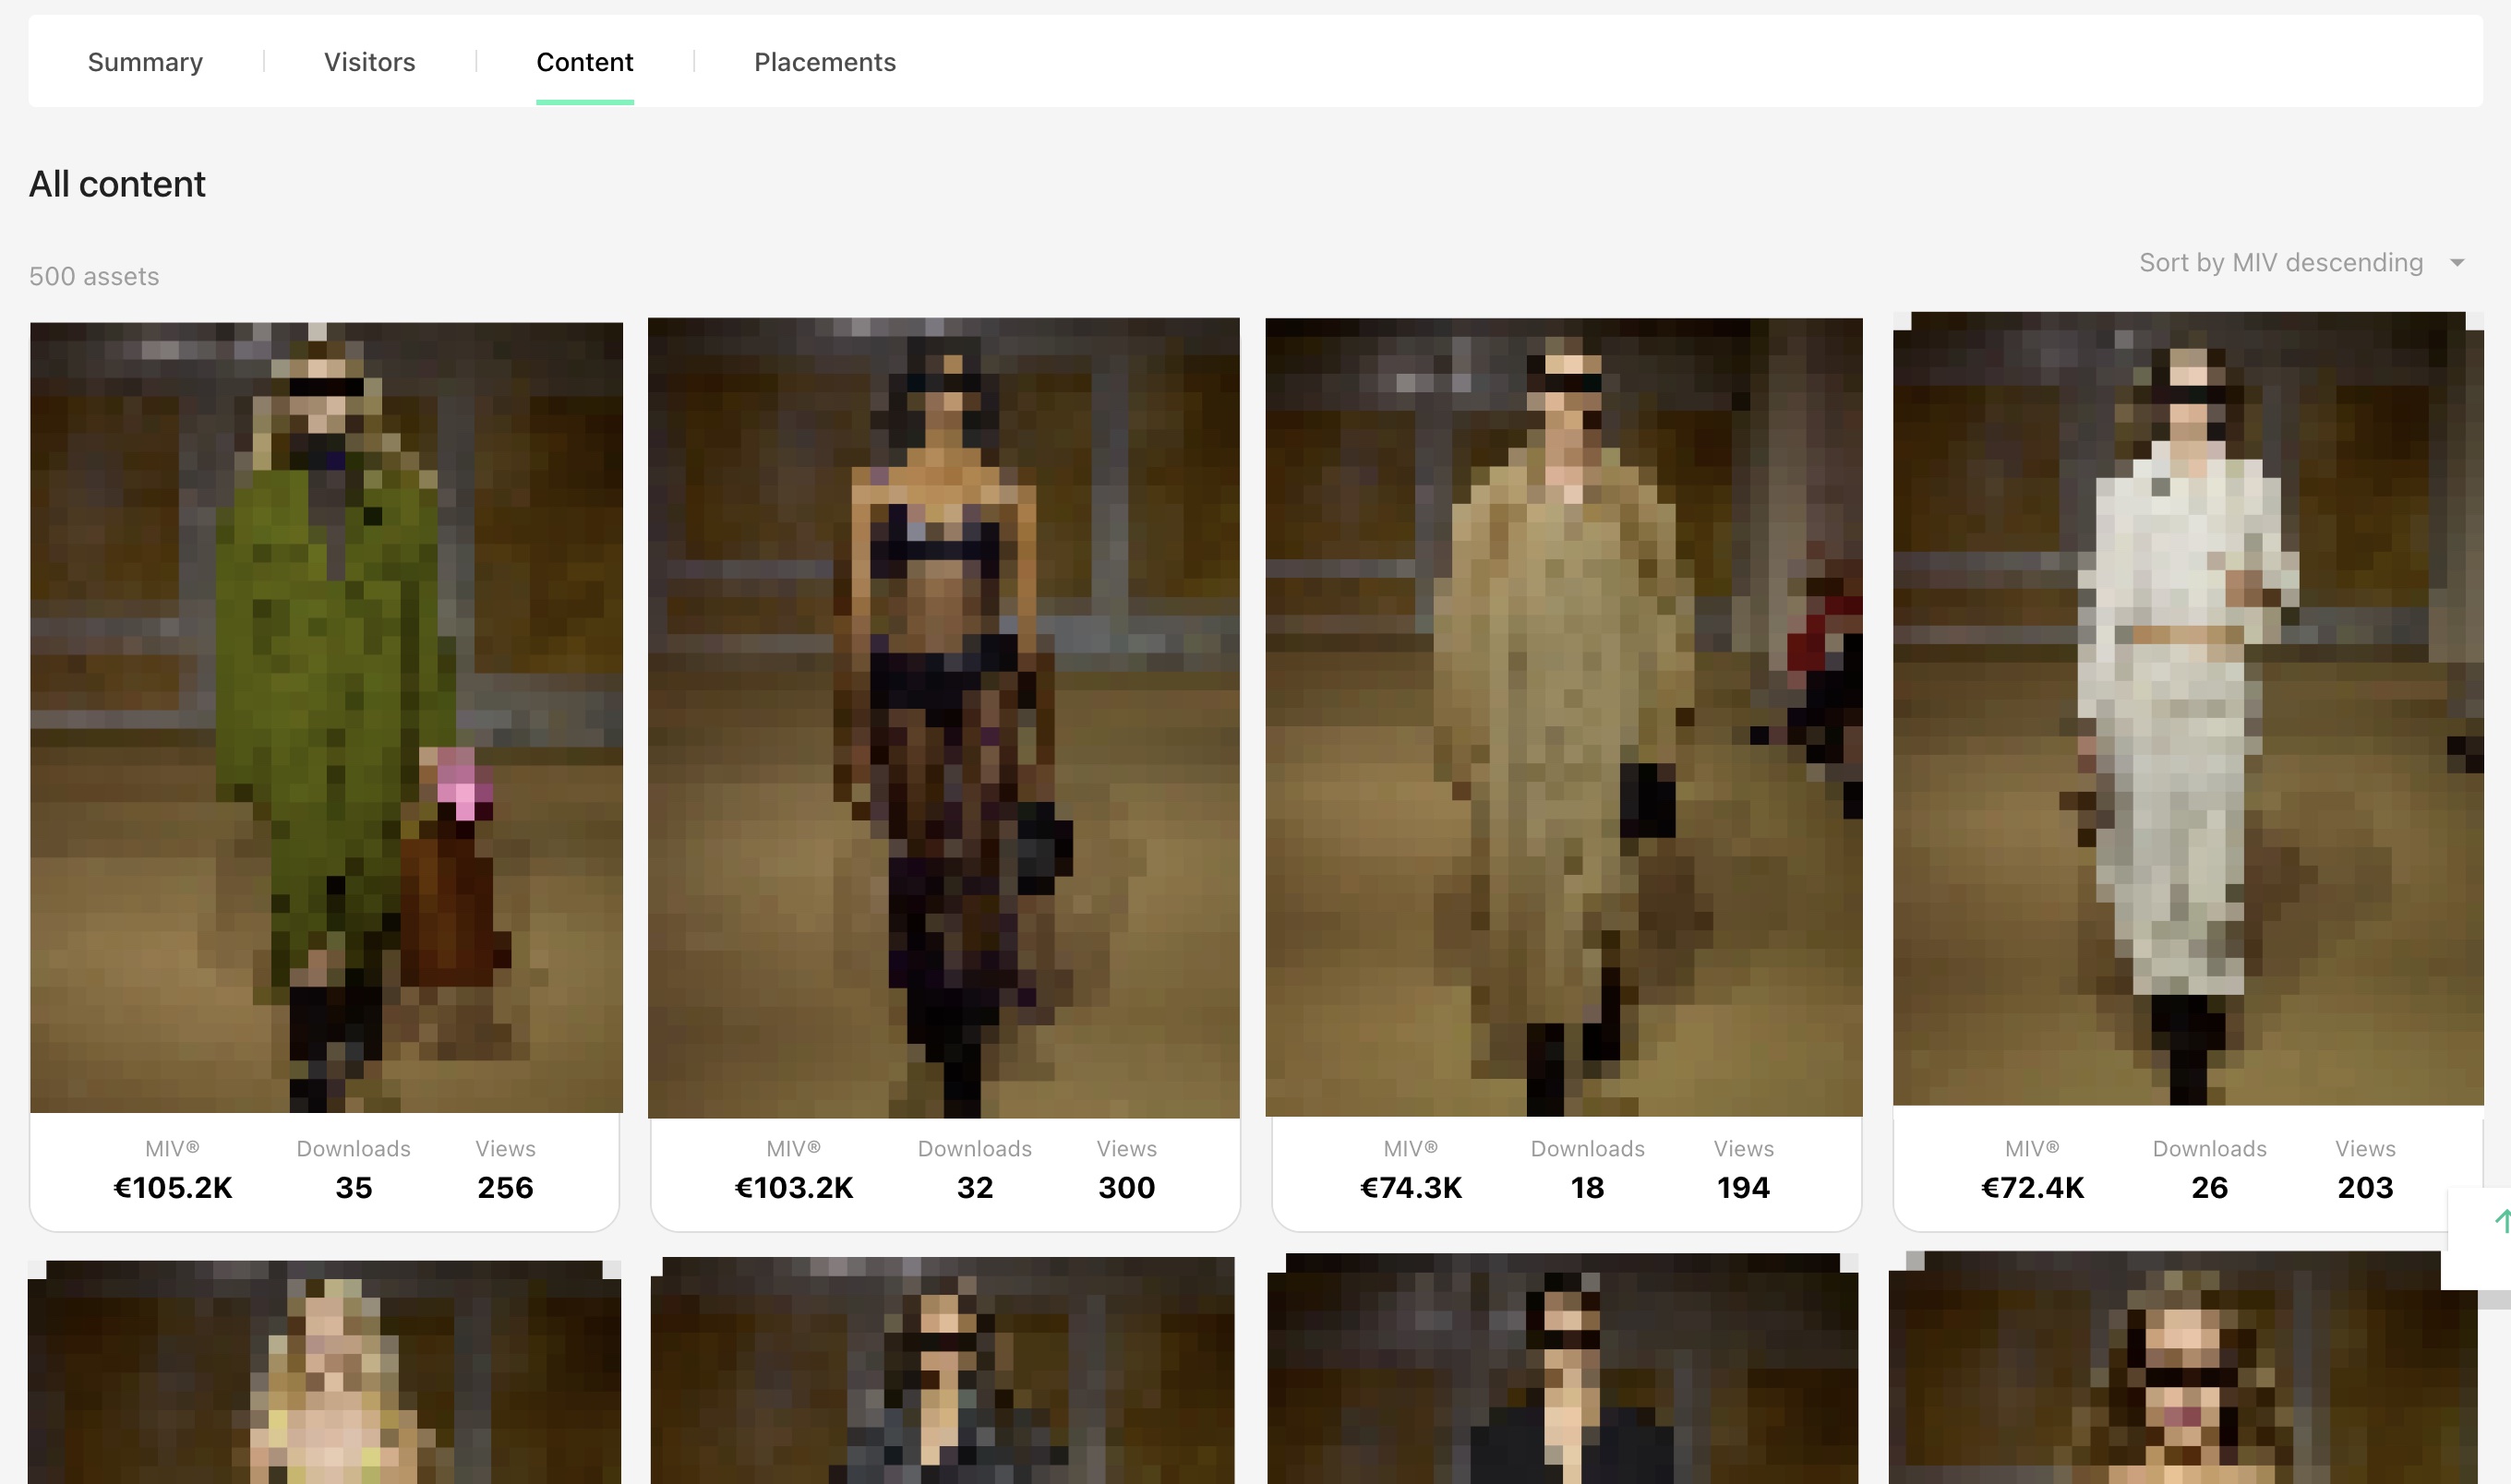 Spotlight Content performance visualisation in Galleries
Online placement Tab
In the same way as the "Content" tab, this tab allows you to monitor the articles that have used your Spotlight images. Each article is displayed in a thumbnail format, showing its cover photo along with the two main data points related to it, namely the Media Impact Value (MIV) and the reach.
By default, the articles are sorted in descending order based on MIV. However, you can change this sorting at any time by using the button located at the top right corner of the page.
When you click on an article, it will open in another tab, allowing you to view the full details of that article.
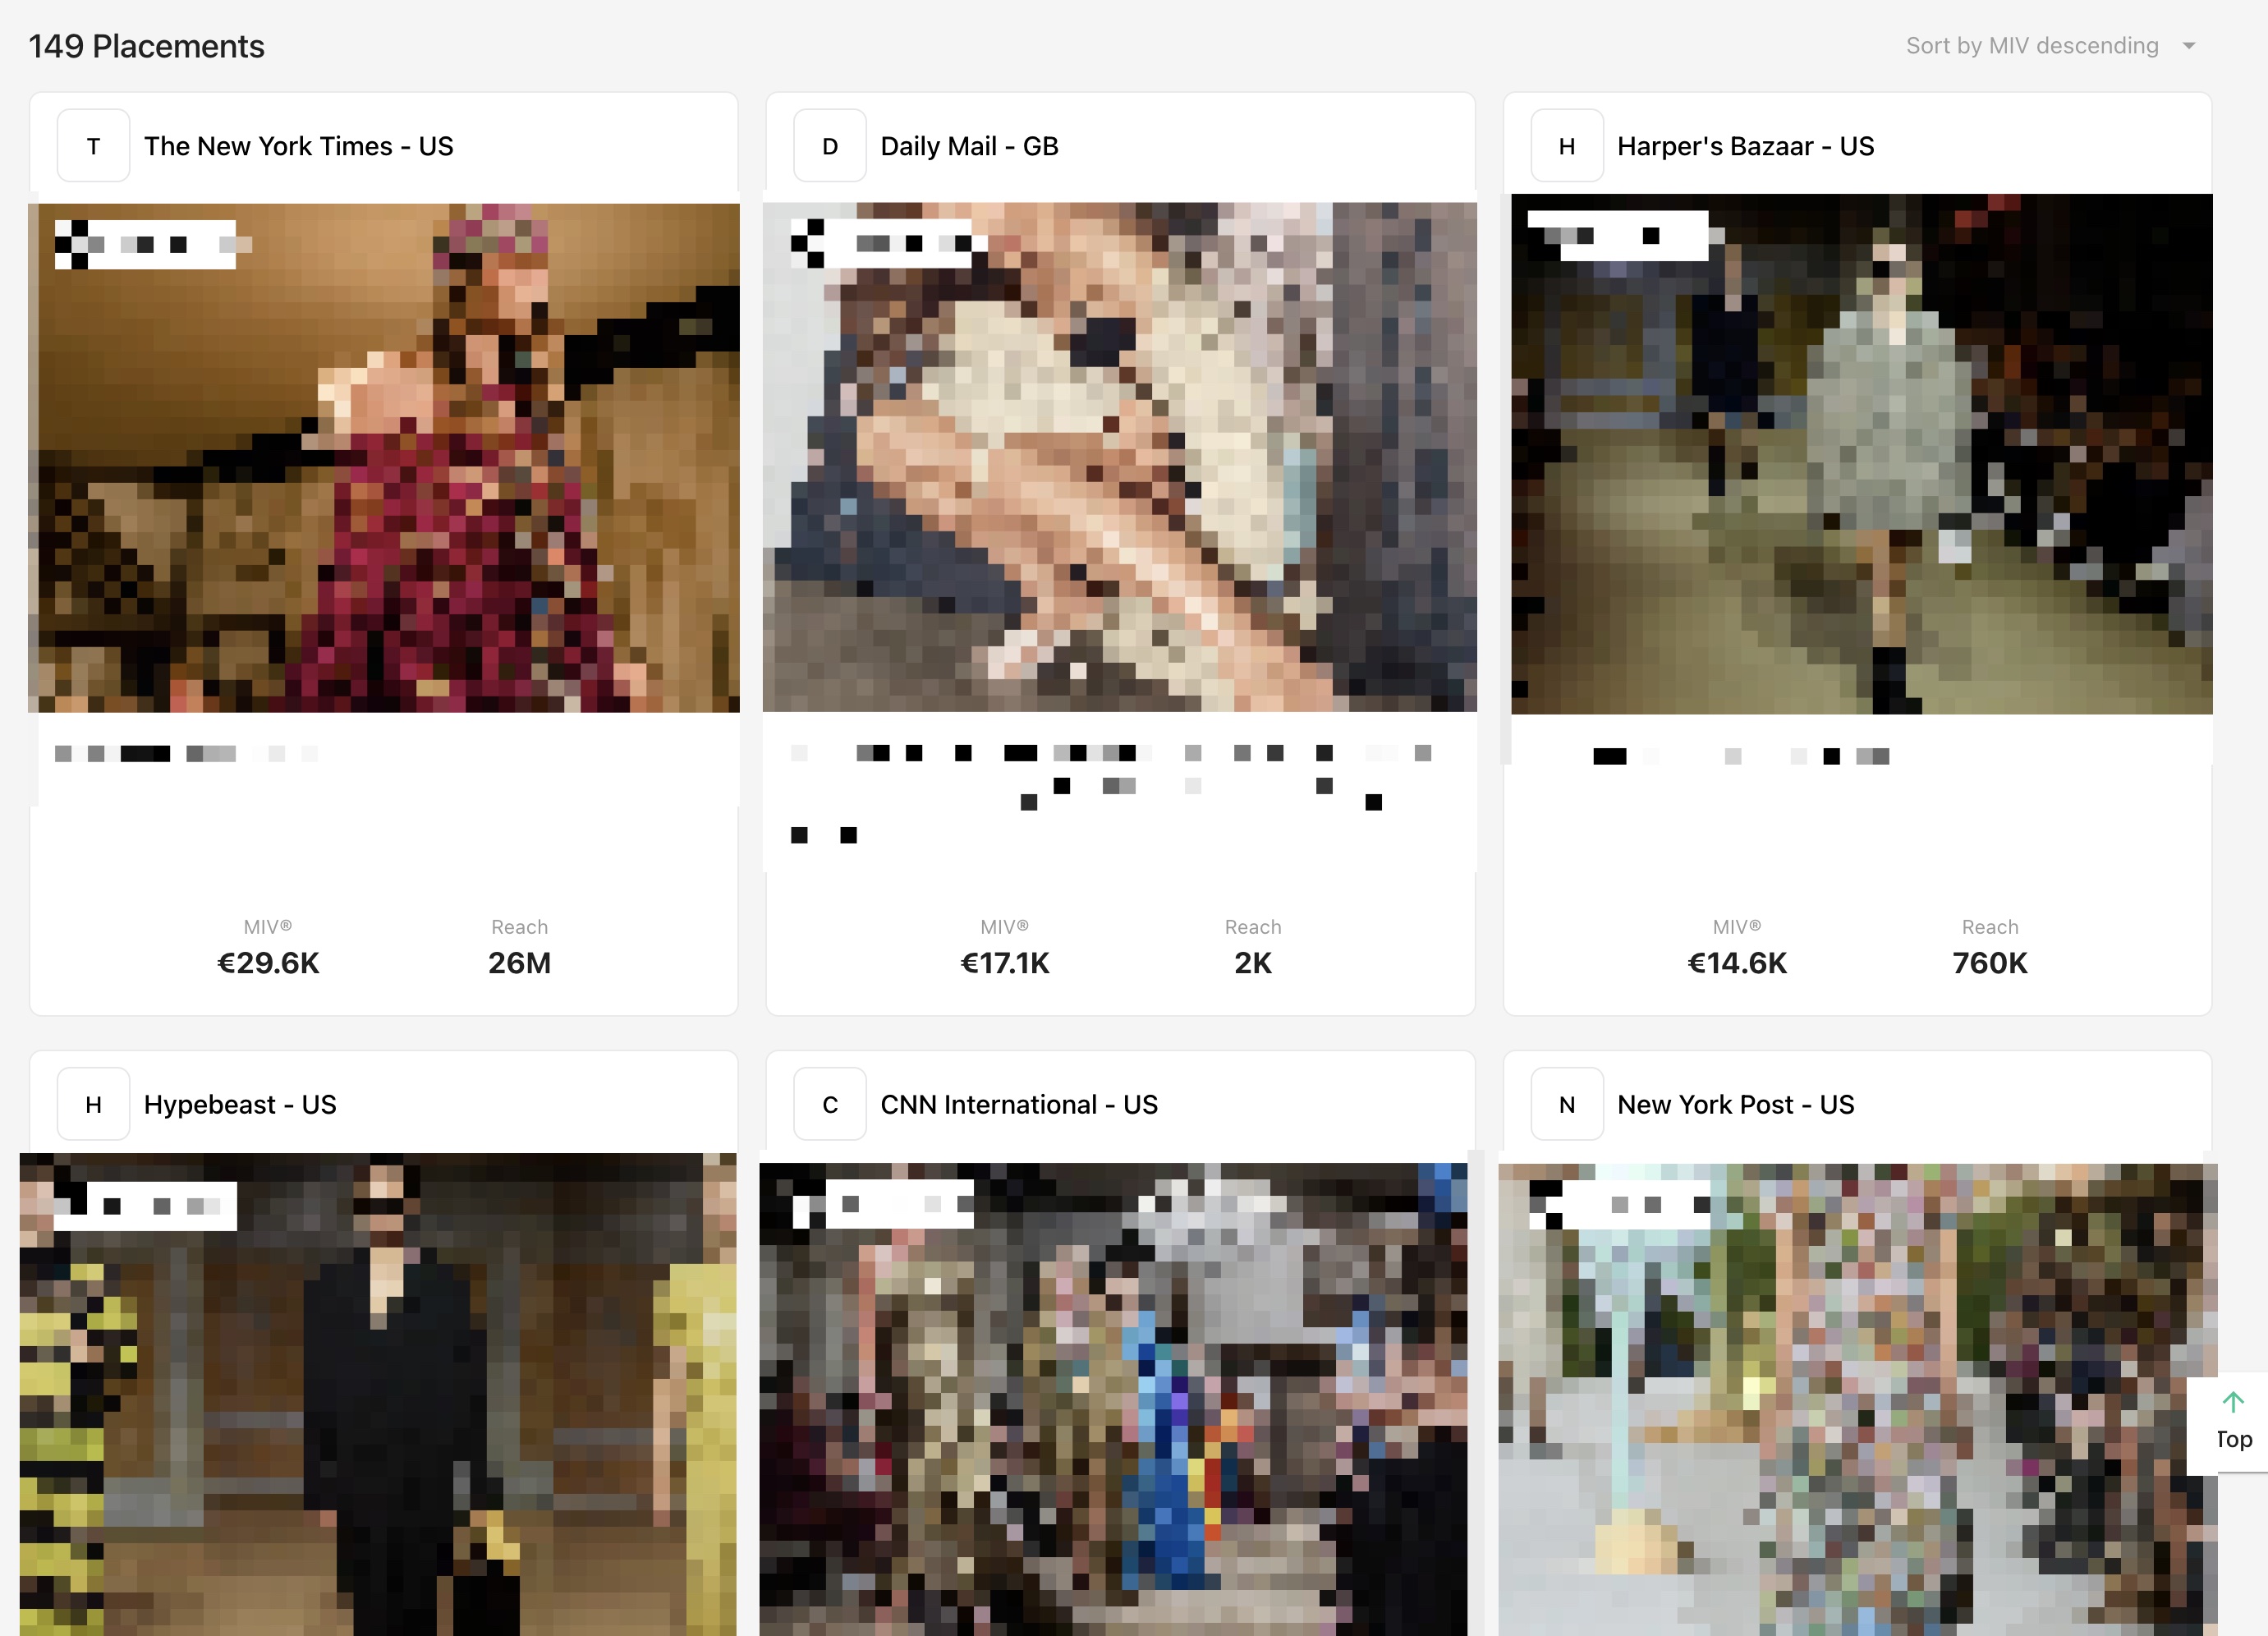 Placement incorporating Spotlight images overview