
Getting started
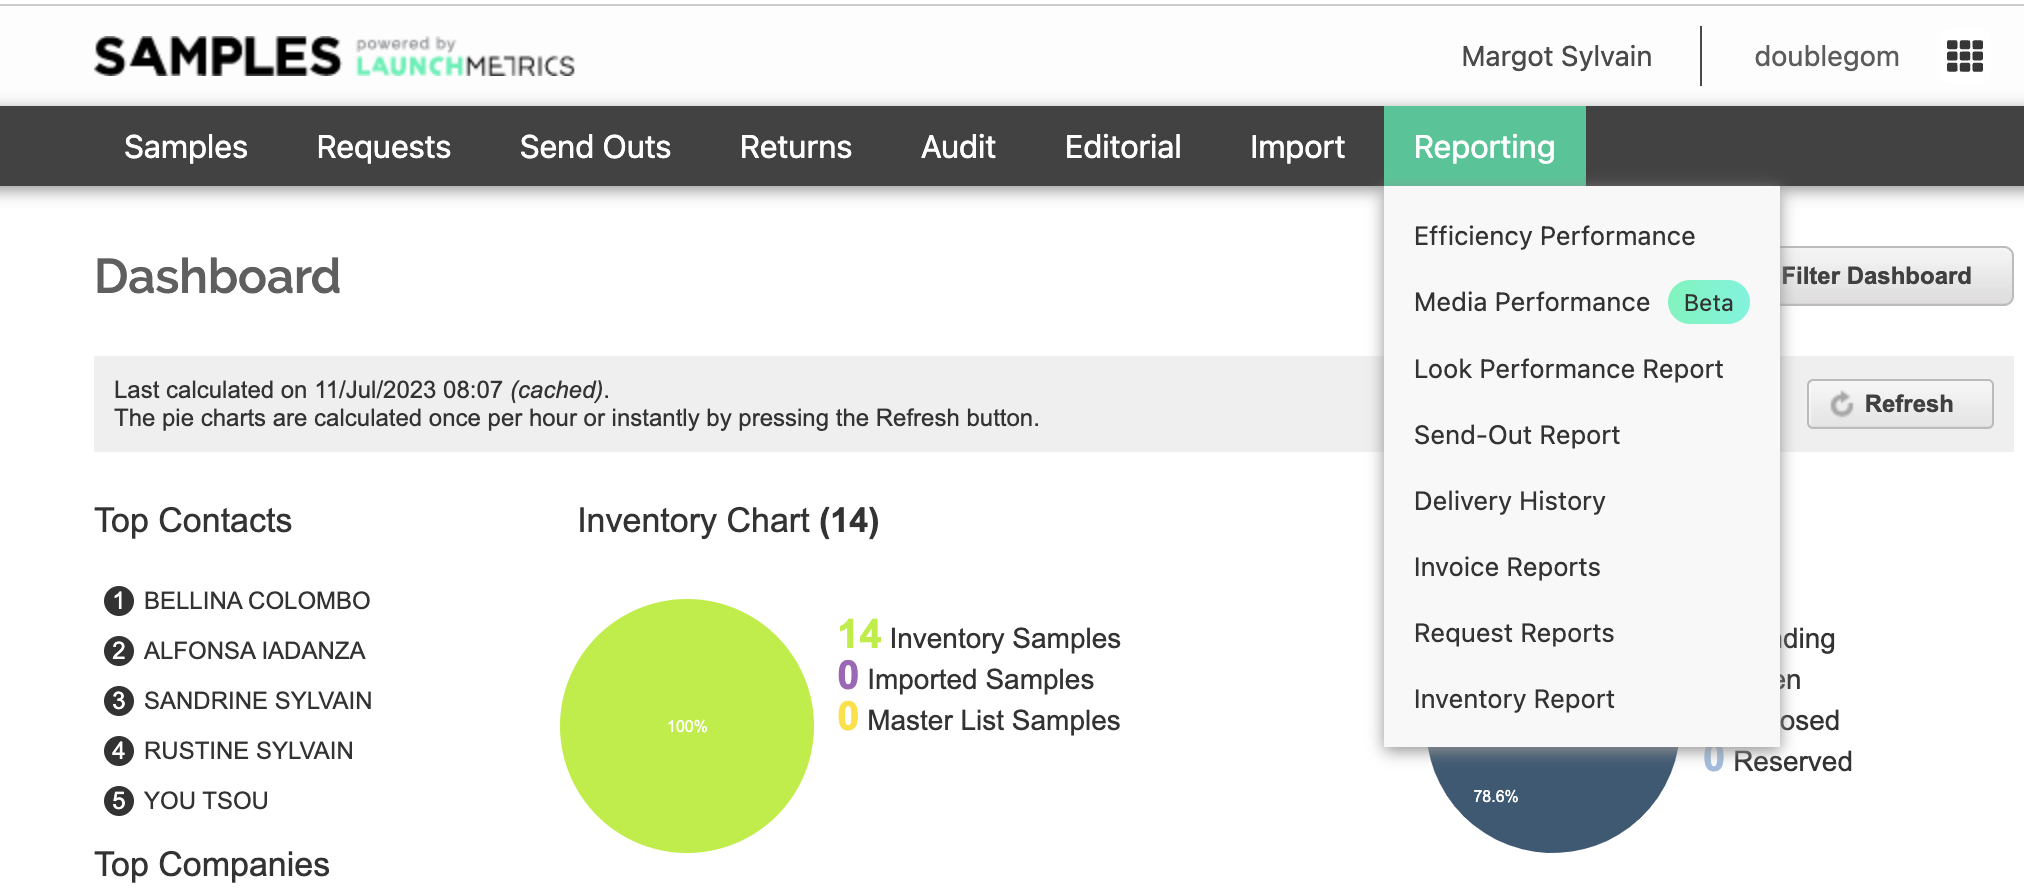
Navigate to your Reports Tab in Samples
Using the filters
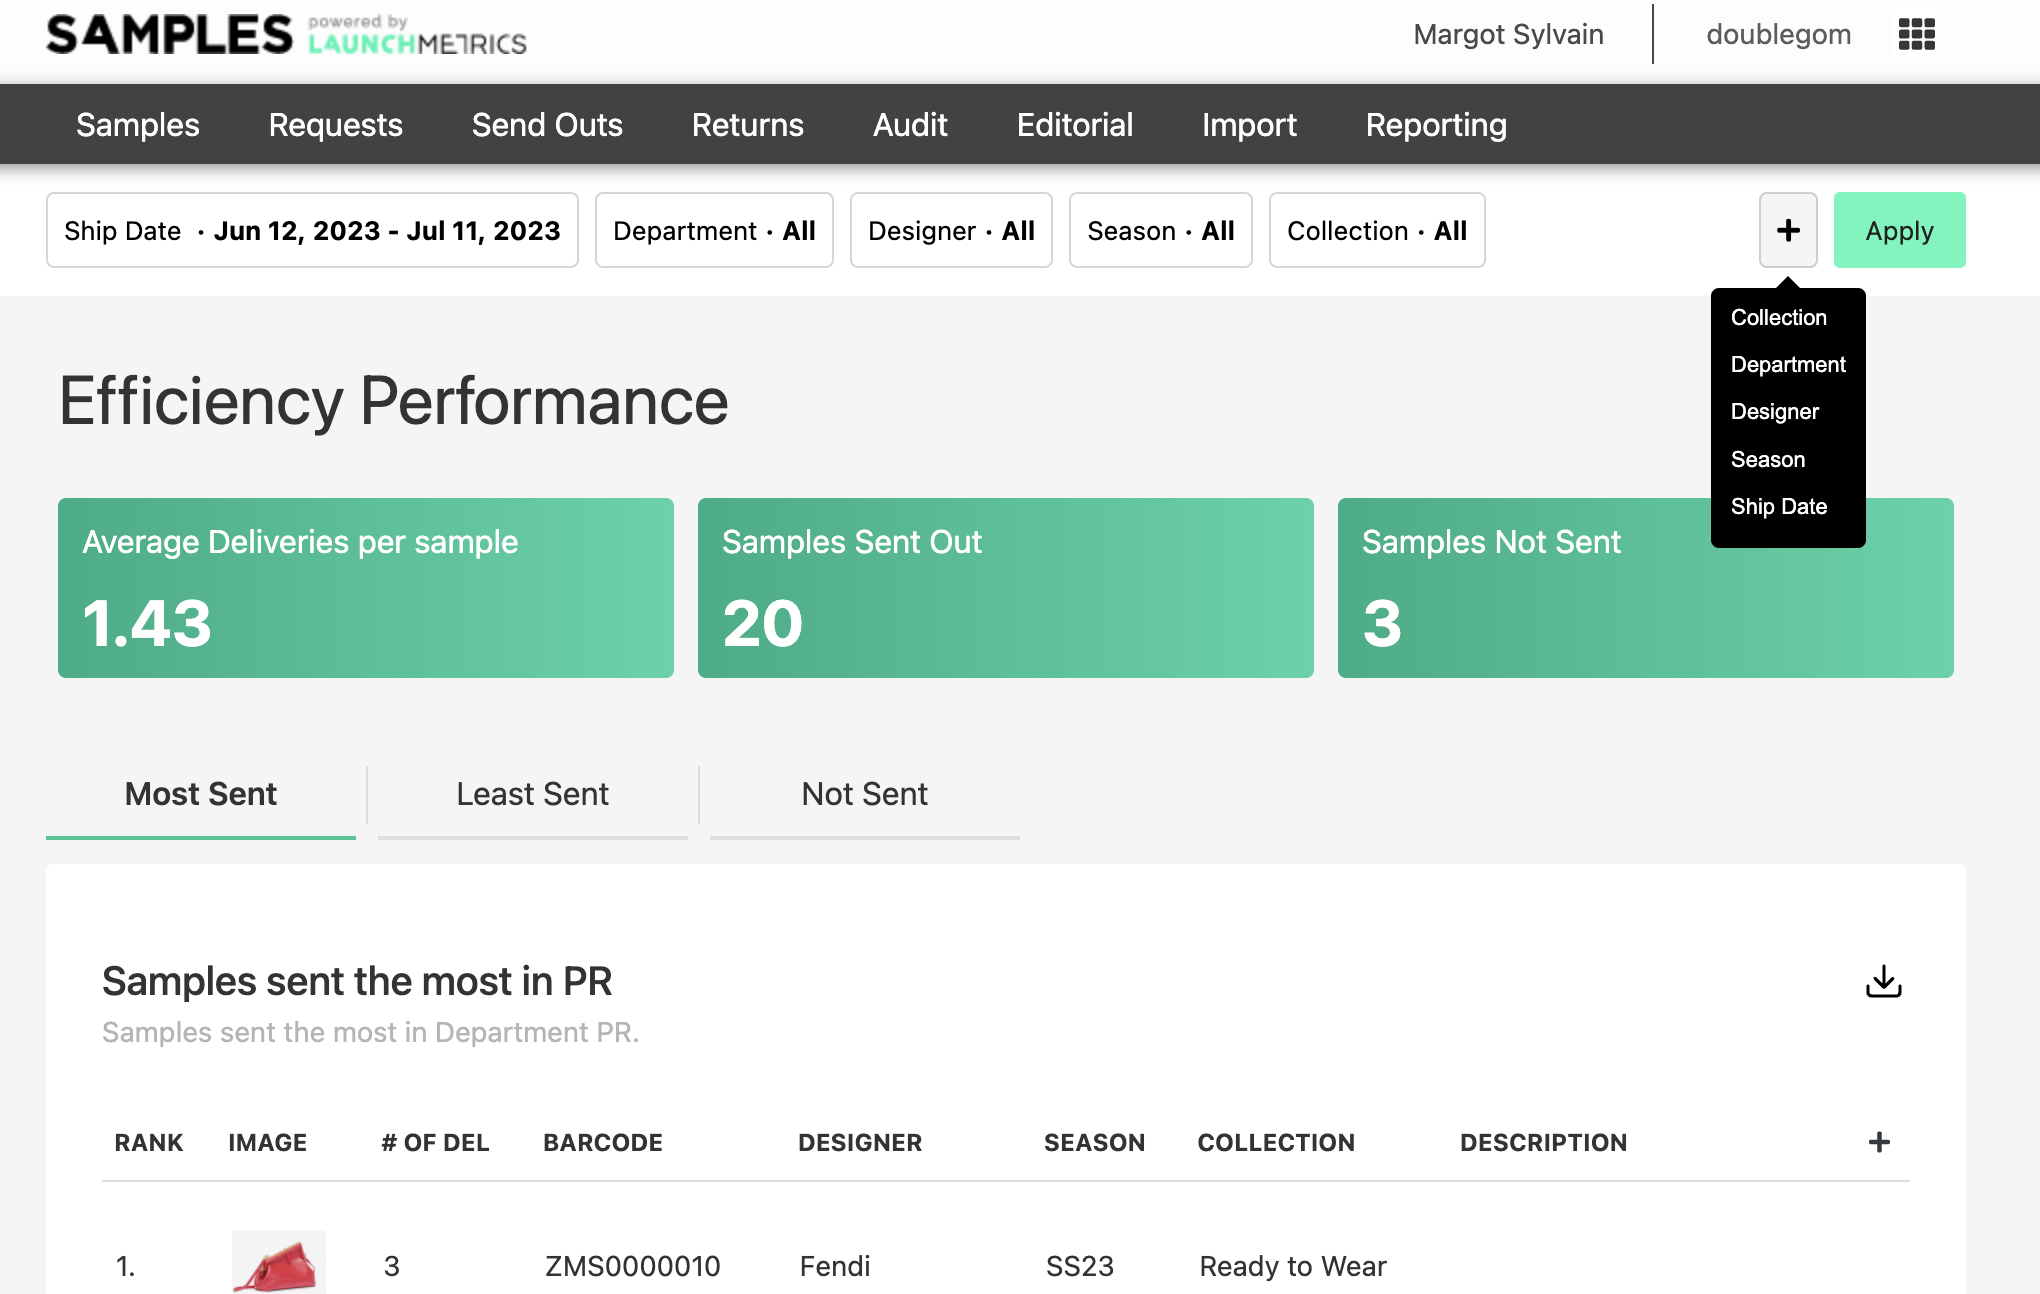
Use the filters at the top of the page to narrow down the scope of the report. By default, the filters available are ship date, Designer, collection, season.
Use the "+" button on the right side of the page to add additional filters to your report.
Once you're happy with your filters, click "Apply".
Reading your report
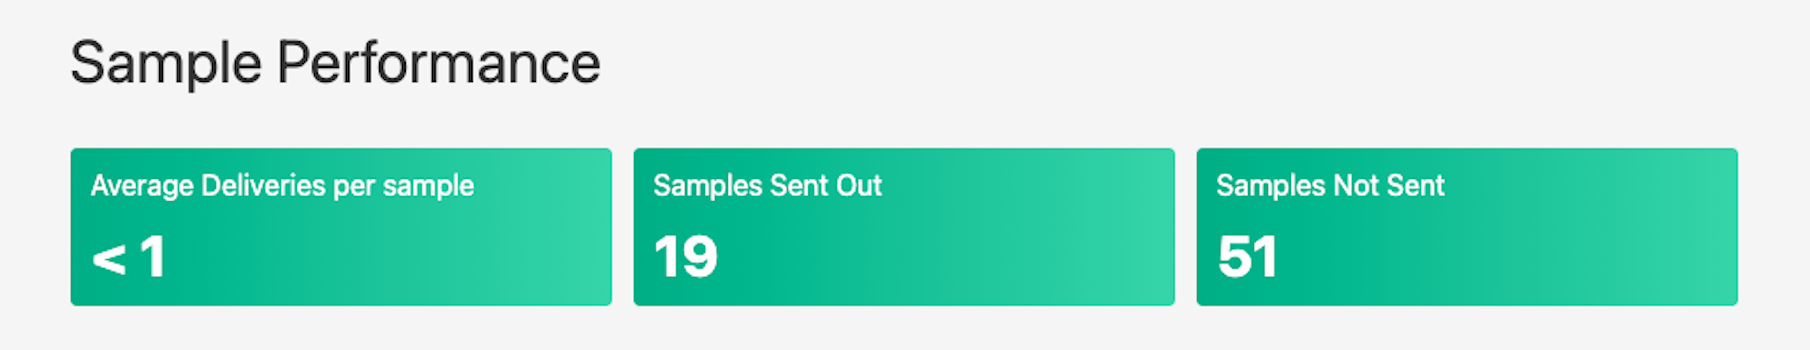
Top Stats
Average number of deliveries per sample — Out of all samples found in the segment, the average number of times a sample was sent out
Total number of samples sent out — Out of all samples found in the segment, the number of times a sample was sent out)
Total number of Samples not sent — The number of samples that were not sent during the segment filtered
Charts
Beneath these main stats you'll see 3 other tabs, "Most Sent", "Least Sent" and "Not Sent".
NOTE: These tabs are showing results during the period specified and are grouped by department.
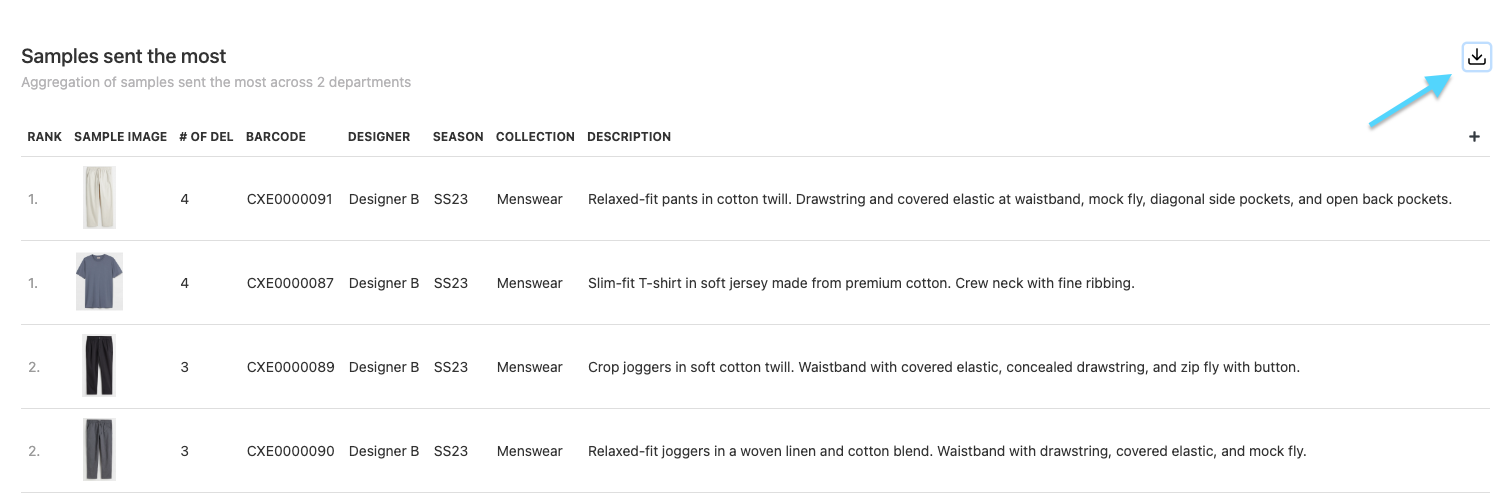
In this section you'll notice another "+" sign on the left-hand side of your headers, this is your "layout preferences" where you can add additional fields to view in your report.
Exporting data within a chart
Exporting raw data is available at the chart level. Click the download icon on the top left-hand side of your results.
The file will contain all samples found in the segment and the number of deliveries they were sent out on, including those never sent during the time period.
Types of analysis you can run
-
Performance of all bags during the last quarter
- Filter by Type & Ship Dates
-
Most/Least popular samples in FW21 sent to Vogue during the last 6 months
- Filter by Season, Recipient Company & Ship Dates
-
Most/Least popular samples sent to publications in Italy during the last year
- Filter by Recipient Country & Ship Dates